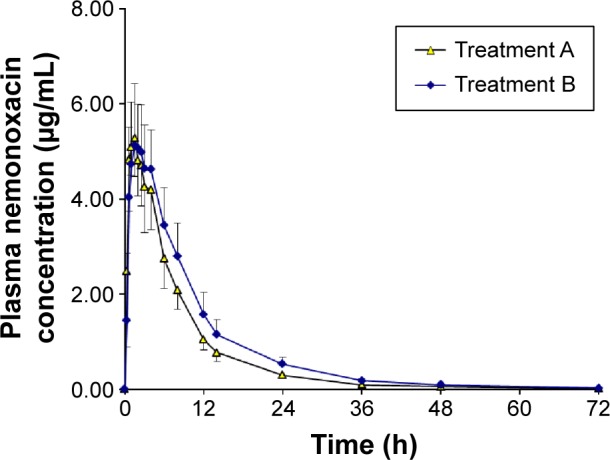
Figure 1.

Plasma concentration–time curves for nemonoxacin after a single oral dose of 500 mg of nemonoxacin alone or with probenecid in 12 healthy Chinese volunteers.
Notes: Treatment A, nemonoxacin alone; Treatment B, nemonoxacin with probenecid; data are mean ± standard deviation.
