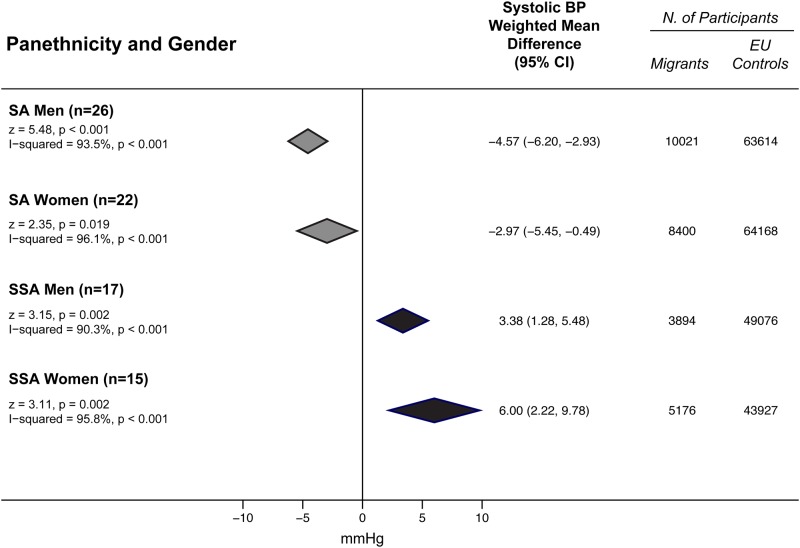
Fig 2. SBP differences between minority groups and EU participants by panethnicity and gender.
Subgroup comparisons of the weighted mean difference of systolic blood pressure (BP) between minority groups and EU participants by panethnicity and gender. Diamonds denote the pooled estimates and 95% confidence intervals. SSA = Sub-Saharan Africans; SA = South Asians; EU = Europeans, “n” is the number of comparisons available for each subgroup.

