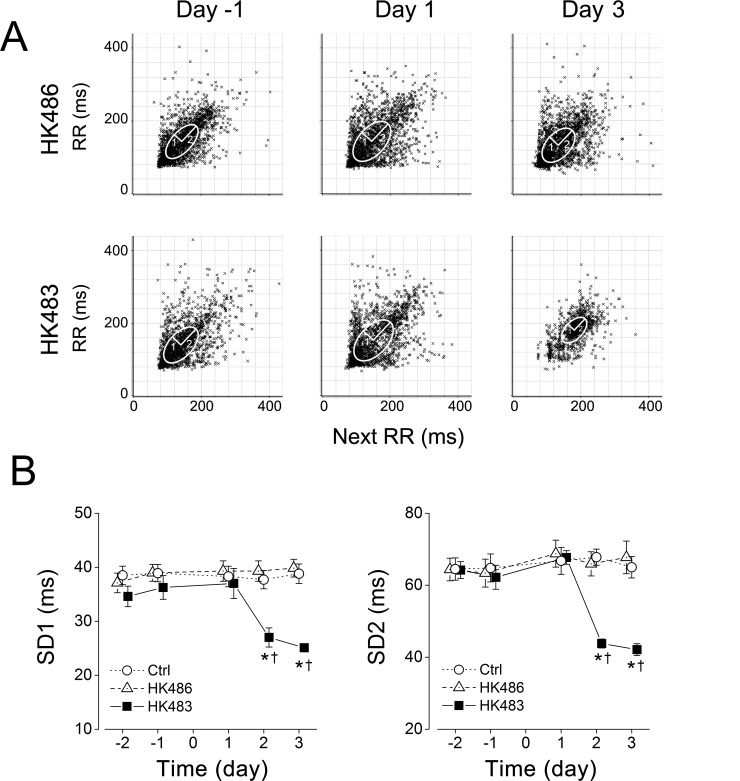
Fig 3. Effects of H5N1 viral infection on the variation of the baseline respiratory intervals (RR).
RR was daily measured in the individual Ctrl, HK483 and HK486 mouse at 2 and 1 days before and 1, 2, and 3 days after intranasal inoculation (Day -2, -1, 1, 2, and 3). A: Poincare plots of RR in an HK486 and an HK483 mice before inoculation (Day -1) and at 1 and 3 days after intranasal inoculation (Day 1, 3). The area of the ellipse describes the distribution of the points with the width of the variation perpendicular to (SD1) and along the line of identify (SD2) [27]. B: Group data of the variability of baseline respiratory intervals (2500 intervals) in each group. Mean ± SE. n = 6, 15, and 7 for Ctrl, HK483 and HK486 mice. * P < 0.01 compared to the previous time-points; † P < 0.01, compared to Ctrl and HK486 at the given day. A less RR variation is observed after HK483 but not HK486 viral infection at 2 and 3 dpi.

