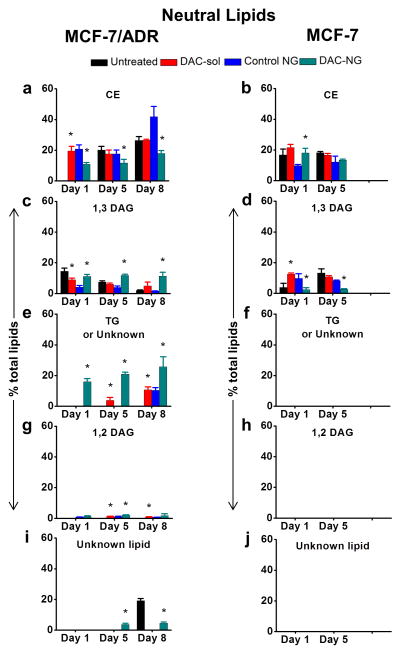
Figure 4. Analysis of levels of different neutral lipids with culturing time and following treatment with DAC.
Cells were treated with DAC (50 ng/mL). Lipids were extracted at different time points and analyzed by HPTLC. Data are shown as mean ± s.e.m., n = 3. *p < 0.05 between respective untreated and treated groups. DAC-sol, DAC in solution; DAC-NG, DAC in nanogel; CE, cholesterol esters; 1,2 DAG/1,3 DAG, 1,2-/1,3-diacylglycerol; TG, triglyceride(s). Not all p-values obtained between lipid levels of untreated resistant cells at different time points are not shown but are as follows: In Figure 4a, c and e, p-values between untreated day1 vs. untreated day 5, untreated day 5 vs. untreated day 8 and untreated day1 vs. untreated day 8 are significant. In Figure 4d p-values between untreated day1 vs. untreated day 5 are significant.

