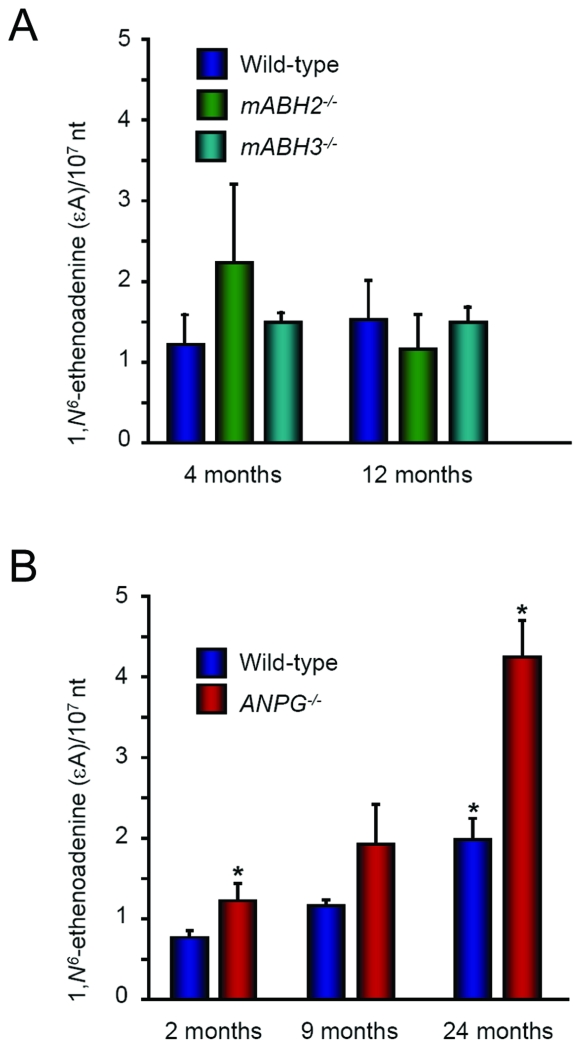
Figure 6. Age-dependent accumulation of εA in wild-type, ABH2−/−, ABH3−/− and ANPG−/− mice.
Histogram graph showing the quantification of εA DNA lesions in liver tissue from wild type, mABH2−/− and mABH3−/− mice ranging in age from 4 to 12-months (panel A) and wild-type and ANPG−/− mice ranging in age from 2 to 24 months (panel B). Lesions were quantified using a highly sensitive HPLC-tandem mass spectrometric (MS-MS) method (30). A minimum of 2 and a maximum of 5 mice were used per time point/per genotype. * p<0.05 24 months ANPG−/− mice compared with 24 months old wild-type or 2 months old ANPG−/− mice.

