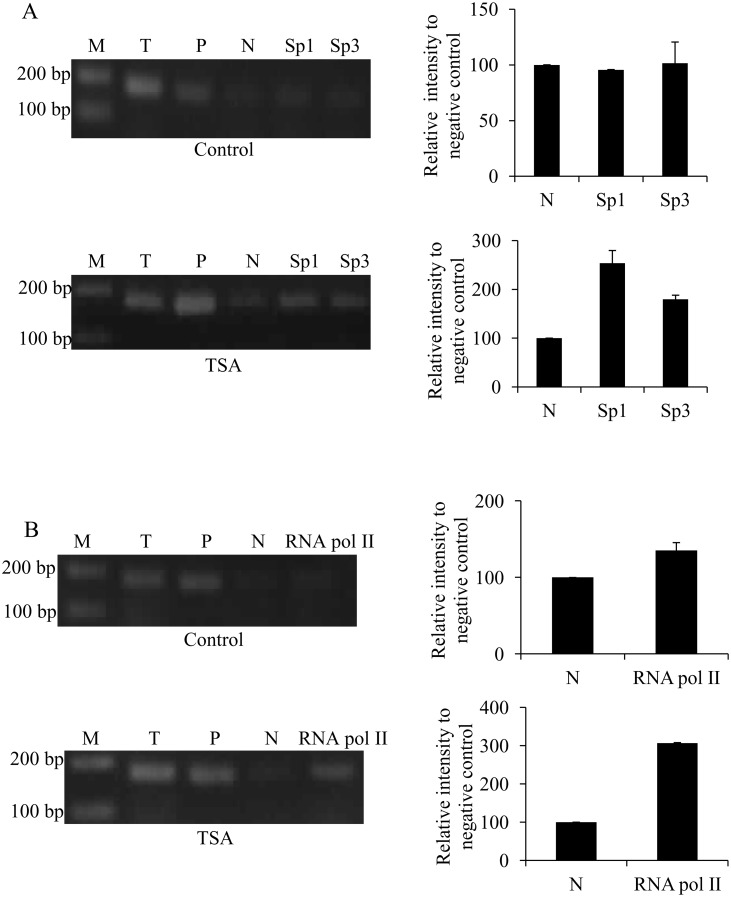
Fig 5. Effects TSA treatment on the binding of Sp1, Sp3 and RNA polymerase II to the ek1 minimal promoter region.
ChIP analysis was performed to confirm the interaction of (A) Sp proteins and (B) RNA polymerase II with the promoter under 1 μM TSA treatment for 24 hours. PCR amplification products were resolved on 2% (w/v) agarose gel and visualized by EtBr staining. Band intensities were quantitated with Image J 1.42 and the relative intensities (compared to negative control) of PCR products from Sp1 and Sp3 immunoprecipitates were plotted. Each bar represents standard error of means (SEM) from two independent experiments. M: GeneRuler™ DNA Ladder Mix; T: total input sample (unprocessed chromatin); P: positive control (amplified using GAPDH primers) and N: pre-immune normal rabbit IgG (negative control).

