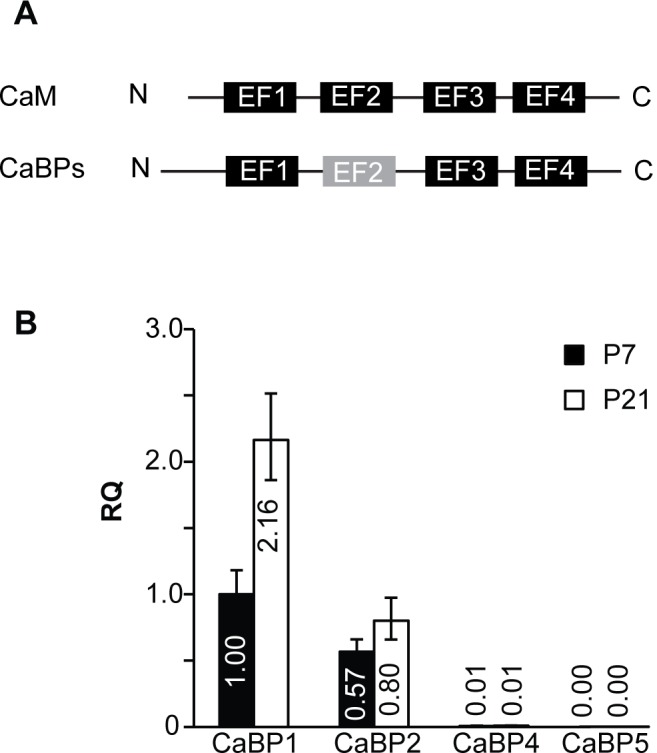
Fig 1. Analysis of CaBP1 and CaBP2 expression in mouse cochlea.

qRT-PCR was performed using RNA isolated from mouse cochleae at P7 and P21. A) Schematic showing EF-hand domain structure of CaM and CaBPs with non-functional EF-2 indicated. B) Levels of total CaBP1 transcripts (CaBP1-L, CaBP1-S and caldendrin) and total CaBP2 transcripts (CaBP2-L, CaBP2-S, and CaBP2-alt). Data are expressed as relative quantities (RQ) compared to total CaBP1 transcripts at P7. Error bars indicate maximum and minimum RQ values calculated from a 95% confidence interval of ΔCT values. n = 8 animals (16 cochleae) per age, 2–3 technical replicates per animal for each PCR assay.
