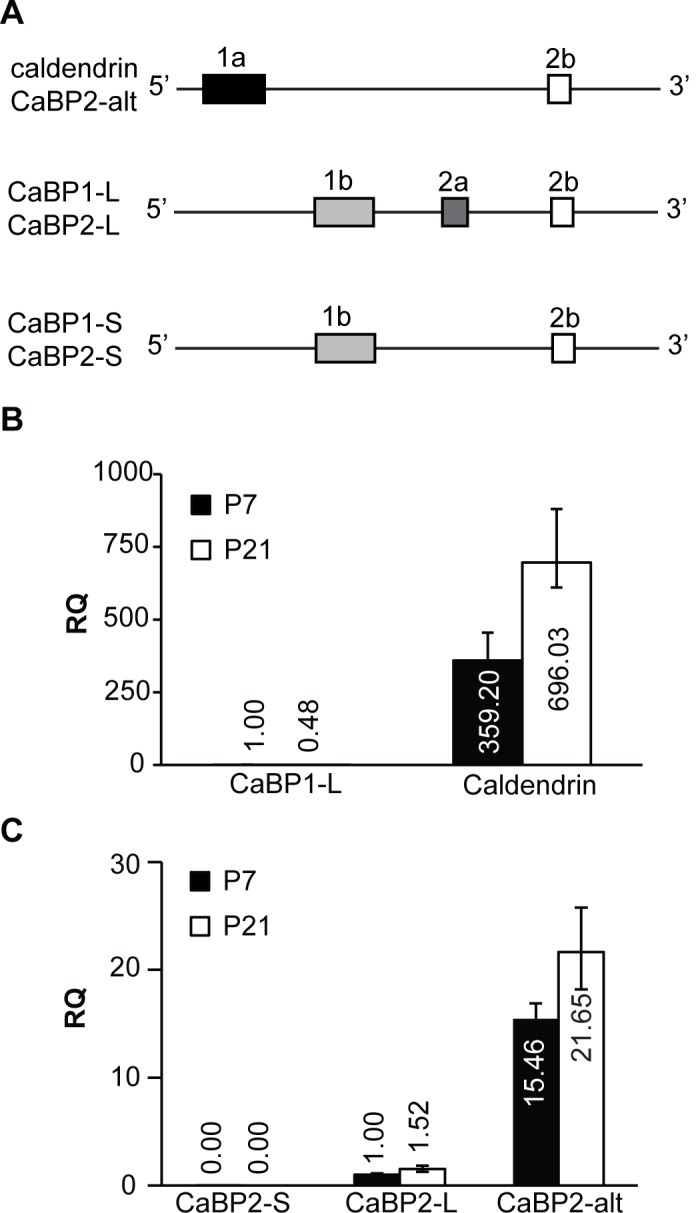
Fig 2. Analysis of CaBP1/2 splice variant expression in mouse cochlea.

A) Schematic showing splice variants of CaBP1 and CaBP2 with differences in the N-terminal region. Although encoded by separate genes, CaBP1 and CaBP2 undergo similar patterns of alternative splicing of exons 1a, 1b, 2a, and 2b. B) Levels of CaBP1-L and caldendrin variants, expressed relative to levels of CaBP1-L at P7. C) Levels of CaBP2-S, CaBP2-L, and CaBP2-alt variants, expressed relative to CaBP2-L at P7. (B-C) Numbers indicate relative quantities. Error bars indicate maximum and minimum RQ values calculated from a 95% confidence interval of ΔCT values. n = 7 animals (14 cochleae) for caldendrin and CaBP1 at P7; n = 8 animals (16 cochleae) per age for the rest of the assays; 2–3 technical replicates per animal for each PCR assay.
