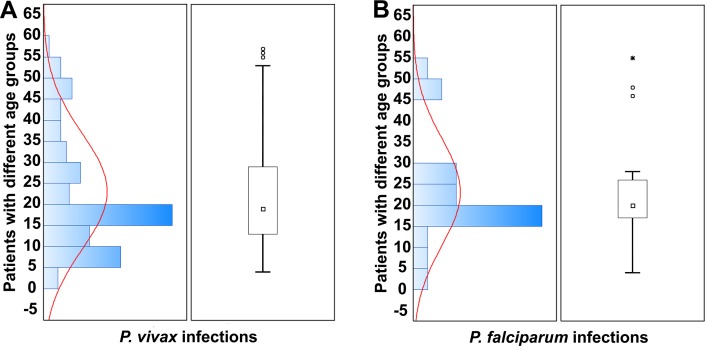
Fig 3. Graphical summary of attributable fractions of malarial infections caused by P. vivax (A) and P. falciparum (B) in different age groups of malarial patients.
Data are presented as histograms (left panel with curve showing the pattern of Plasmodium infection incidence in different age groups), and box and whisker plots (right panel) showing median (□), lower quartile, upper quartile, outliers (○), and extreme score (*) of their respective sample distributions.

