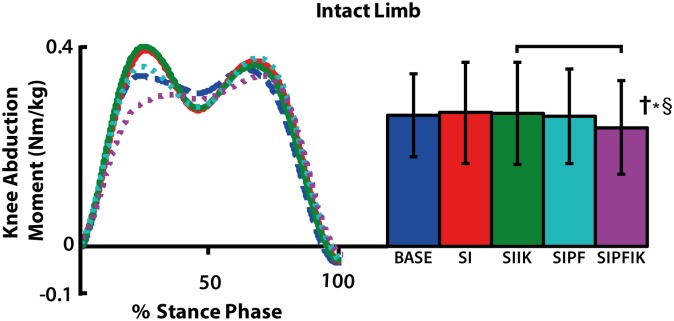
Fig 10. Stance phase intact knee abduction moment.
Group average traces and average positive values of knee abduction moment are shown. Significant interaction effects of powered plantar flexion and increasing stiffness (†*§) are denoted. Significant pairwise t-test results are indicated with brackets.

