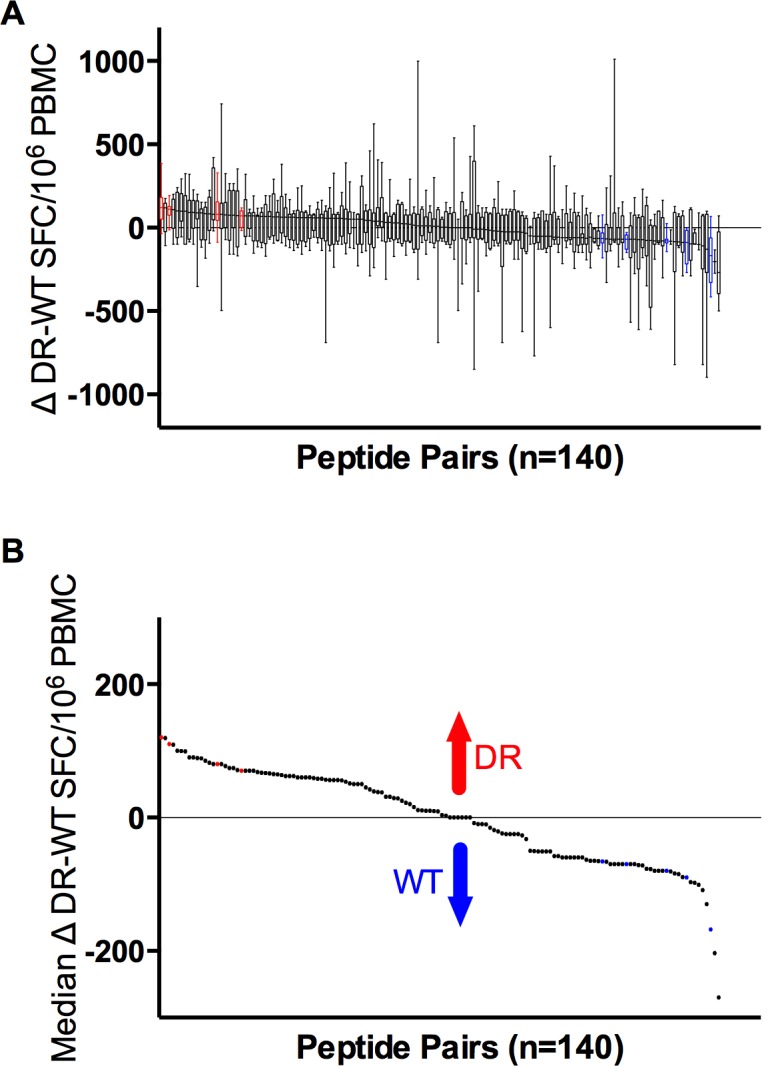
Fig 2. Wide spectrum of differential magnitudes of response to WT and DR peptide pairs.

A. Differential magnitudes of response to each DR-WT peptide pair (Δ) are shown for each responder. Δ were calculated as the magnitude of response (SFC/million PBMC) to the DR sequence minus the magnitude of response to the WT sequence in each subject individually. A median differential magnitude of response was then calculated across all individuals responding to either the WT, the DR or both sequences. Boxes represent 50% of differential magnitude to each DR-WT peptide pair, whiskers maximum and minimum of the differential magnitude. B. Only median Δ responses are shown. Peptide pairs with significantly higher differential response to DR are shown in red; peptide pairs with significantly higher differential response to WT are shown in blue (p<0.05).
