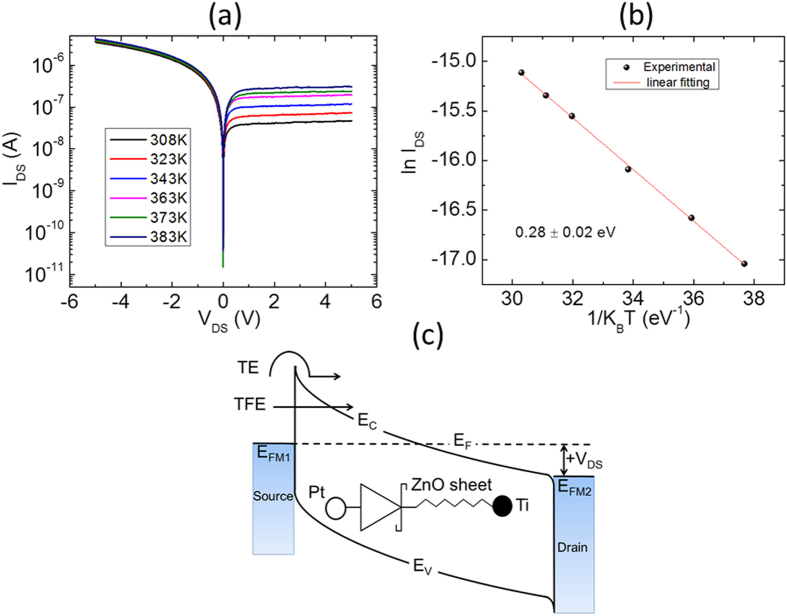
Figure 4.
(a) I–V characteristics of Pt-ZnO contact as a function of temperature from 308 to 383 K. (b) Arrhenius plot. The activation barrier energy is extracted from the plot by measuring the slope of the curve which comes to be 0.28 ± 0.02 eV. (c) Simplified energy band diagram for Pt-ZnO-Ti system under thermal equilibrium at positive VDS. Also schematically showing the two dominant charge carrier injection mechanism (TE and TFE) at reverse biased Schottky contact. EFM1 and EFM2 are the Fermi level for metals Pt and Ti, respectively.

