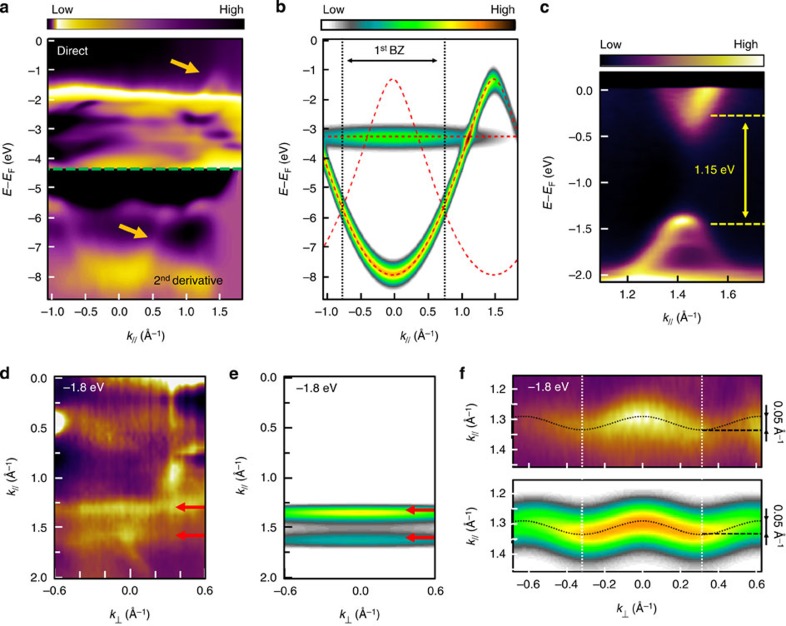
Figure 3. Angle-resolved photoelectron spectroscopy measurements.
(a) ARPES intensity map measured along the <1–12> direction, parallel to the polymers chains for 1ML-PPP/Cu(110). The bottom part is displayed in second derivative. Arrows indicate bands due to the presence of polymers. (b) Tight-binding modelling of the band structure of the N=20 PPP polymer using β=−3.5 eV. (c) High-resolution ARPES intensity map recorded close to the Fermi level showing the HOMO–LUMO bandgap. Measurements (d) and tight-binding modelling (e) of the ARPES constant energy map at −1.8 eV. (f) Zoom on the measured (top) and calculated (bottom) ARPES constant energy maps. The transverse resonance integral used in the calculations is β′=−0.15 eV.

