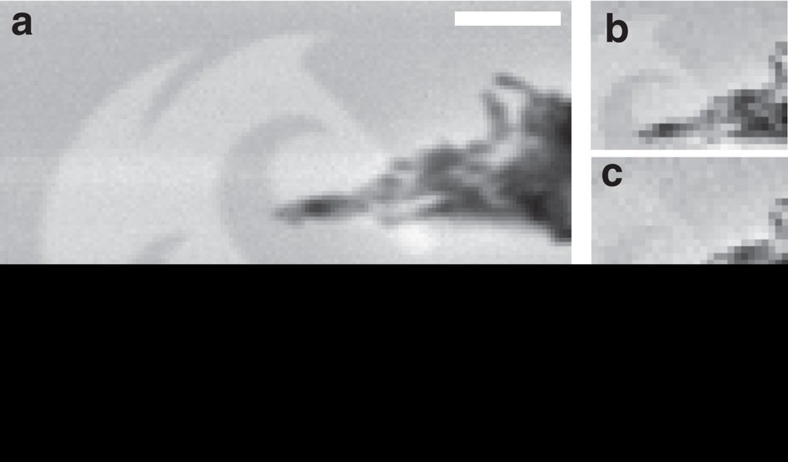
Figure 2. Comparison of contrast mechanisms accessible by SHeM.
Micrographs of a gold University of Newcastle logo partially obscured by a piece of dust. (a) Full image taken with the sample at specular, while b shows a section of the sample at the same position. (c,d) Small region of the sample at 500 and 1,000 μm further back from the pinhole respectively. Scale bar, 50 μm.

