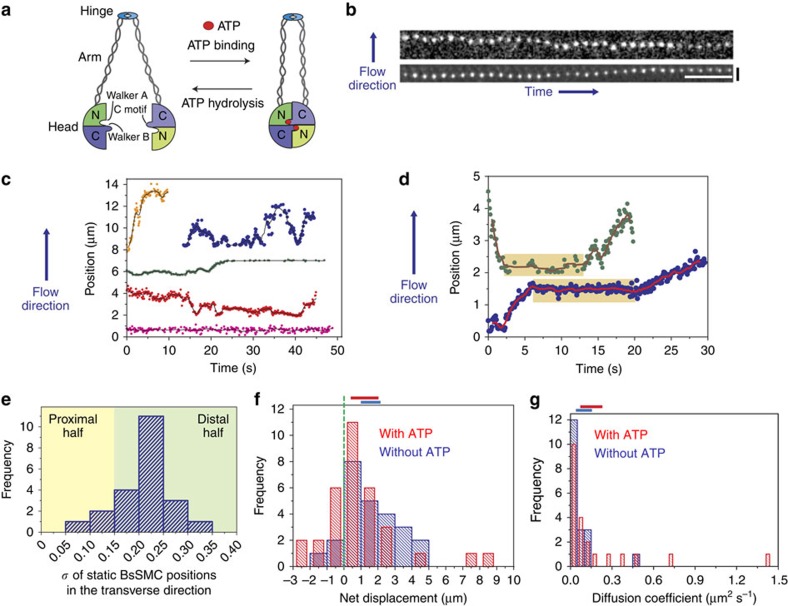
Figure 1. Characterization of BsSMC sliding along DNA.
(a) Cartoon of the BsSMC dimer. The Walker A motif resides on the N-terminal half of the head, while Walker B and C motifs are located at the C terminal part of the head. Not drawn to scale. (b) Snapshots from two different DNAs showing diffusion of labelled wild-type BsSMC (∼2 nM) on a flow-stretched DNA in the presence of 1 mM ATP. White and black scale bars, 5 s and 3 μm, respectively. (c) Trajectories of BsSMC in the presence of 1 mM ATP. Different events were denoted with different colours, and the starting point of each event was arbitrarily set for visualization on the same plot. (d) Two trajectories of wild-type BsSMC showing transitions between static association and 1D diffusion in the presence of 1 mM ATP. Light-brown boxes represent periods of static binding as defined by the criteria described in the text. (e) A histogram of s.d. of statically bound BsSMC position in the transverse direction (n=22). Light-yellow and green colours denote approximate regions of the proximal and distal halves of the λ-DNA, respectively. This distinction was determined based on the characterization of transverse fluctuation along the DNA length (Supplementary Fig. 1e). (f) Histograms of net displacement. Positive values represent net displacement towards the free end of the DNA. A dotted vertical green line represents zero net displacement. Horizontal blue (n=25) and red (n=33) bars in the histogram represent data without and with ATP, respectively (P>0.2 by t-test). The horizontal blue (without ATP) and red (with ATP) lines on the top of the graph represent 95% confidence intervals obtained by bootstrapping analyses. (g) Histograms for diffusion coefficients of wild-type BsSMC. n=19 for blue bars, n=21 for red bars (P>0.2 by t-test). The horizontal blue (without ATP) and red (with ATP) lines on the top of the graph correspond to 95% confidence intervals from bootstrapping analysis.

