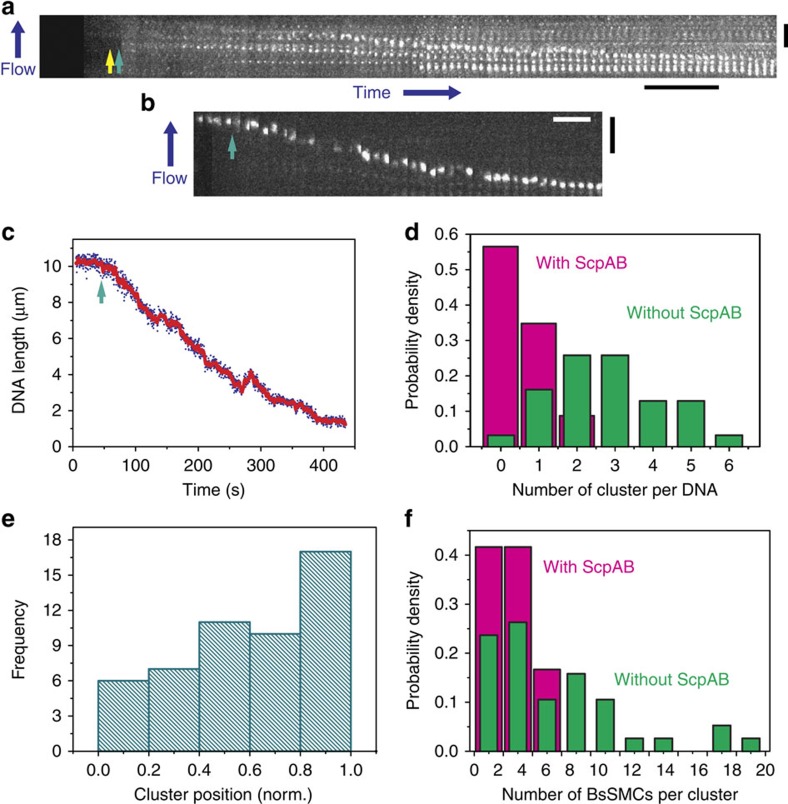
Figure 2. BsSMC molecules can form clusters on DNA.
(a) Example kymograph depicting BsSMC cluster formation in the absence of ATP. The appearance of the first visible cluster is marked with a yellow arrow, and the onset of compaction, identified by tracking a DNA end-labelled quantum dot (shown in b and c), is marked with a green arrow. Scale bars, 40 s, 5 μm (for both panels). (b,c) Kymogram and trajectory of the spectrally distinct quantum dot attached at the end of DNA shown in a. Again, the starting point of compaction is marked with a green arrow. (d) Number of clusters on DNA in both the presence (magenta, n=23) and absence (green, n=31) of ScpAB. [BsSMC]=120 nM, [ATP]=1 mM, ([ScpA]=480 nM, [ScpB]=960 nM), 5 min after sample loading. (e) Estimated cluster positions normalized with respect to tether point (position: 0.0) and the end of DNA (position: 1.0) in the presence of ATP and absence of ScpAB. (f) Estimated number of BsSMC within a cluster in both the presence (magenta, n=12) and absence (green, n=38) of ScpAB. [ATP]=1 mM.

