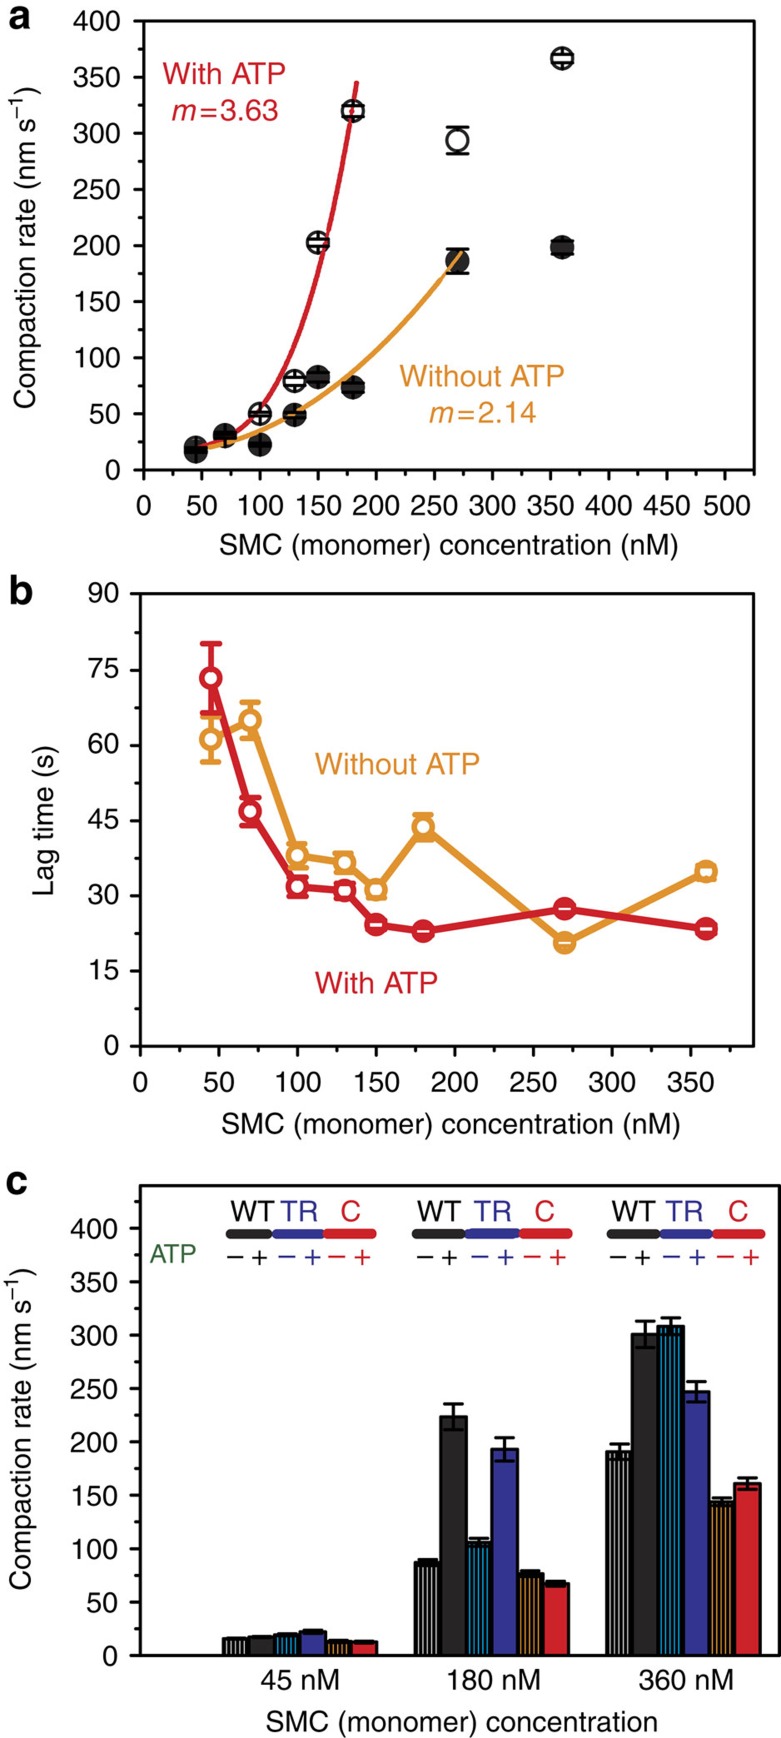
Figure 4. BsSMC compacts DNA in a weakly ATP-dependent manner.
(a) Compaction rate versus BsSMC concentration. ‘m' was obtained from the least-square fitting of Rate ∝ [BsSMC]m for data points before the compaction rate saturating. Closed and open circles represent data points (n ranged from 14 to 73) without and with ATP, respectively. Error bar: s.e.m. (b) Lag time versus BsSMC concentration (n ranged from 14 to 73). Error bar: s.e.m. (c) Compaction rates for wild-type (WT), transition-state (TR) and C-motif (C) mutants BsSMC both in the absence and presence of ATP (n ranged from 32 to 131). Error bar: s.e.m.

