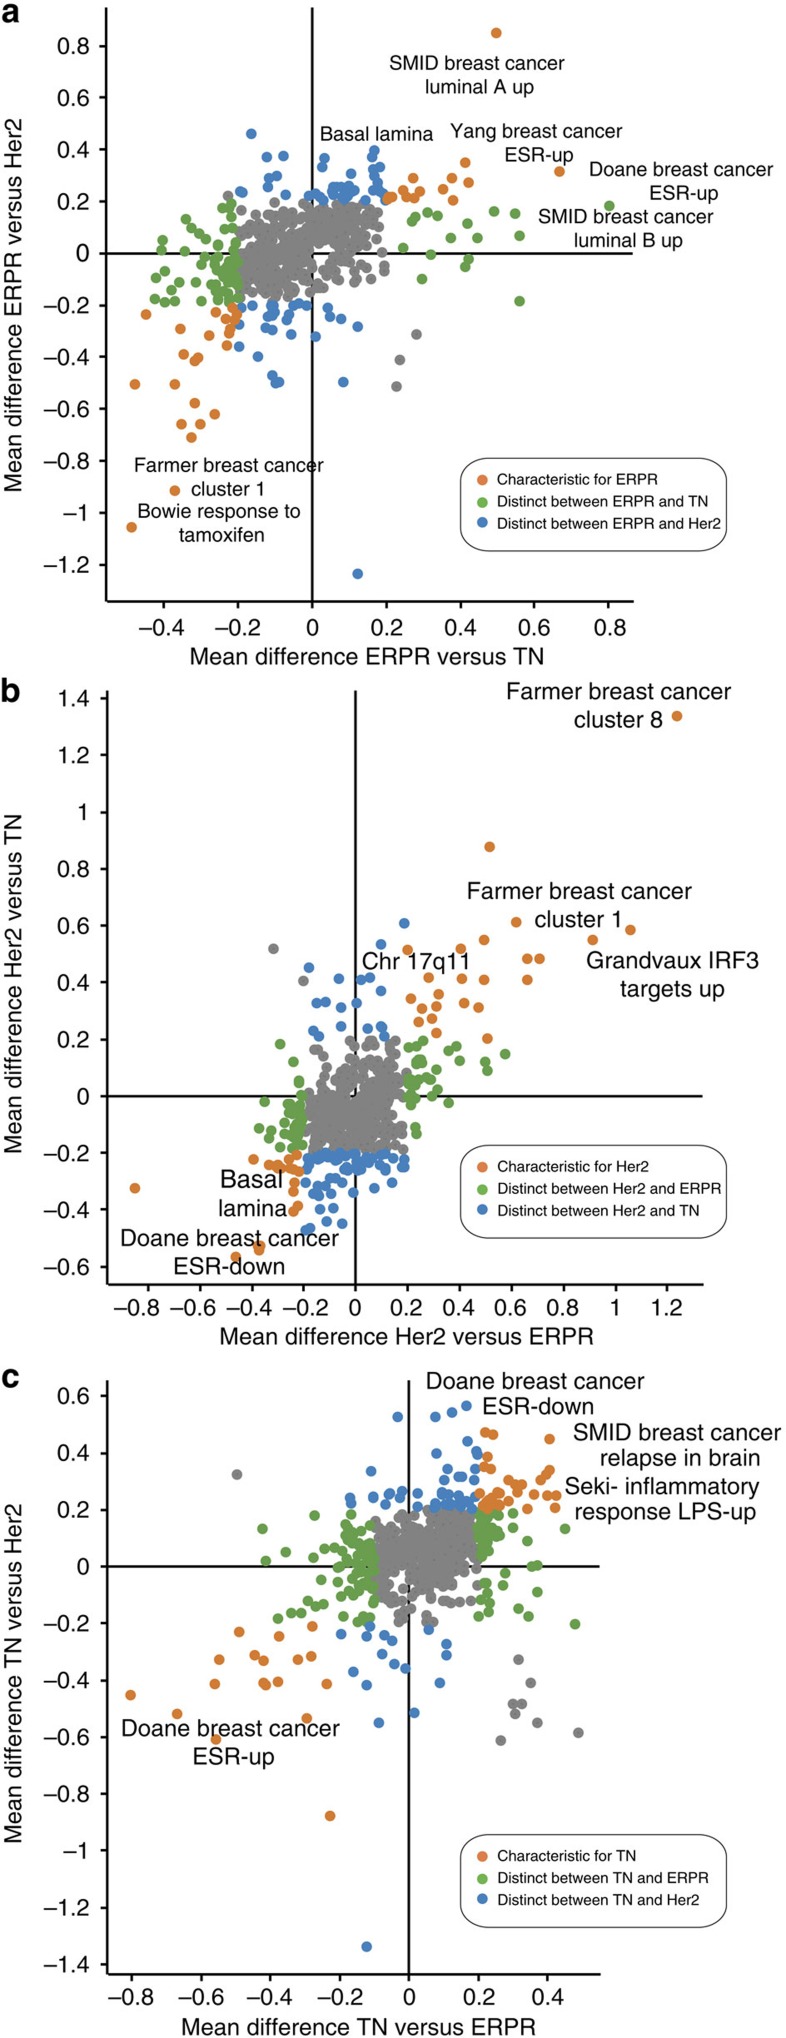
Figure 2. Molecular signatures database (MSigDB) analysis.
Enrichment analysis of molecular signatures from the MSigDB database was performed on the average protein fold changes between the ER (a), Her2 (b) and TN (c) subtypes. Molecular signatures that differentiate one subtype with respect to both other subtypes are shown in orange, whereas categories that differ only between two subtypes are shown in blue or green. Complete list is given in Supplementary Data 3.

