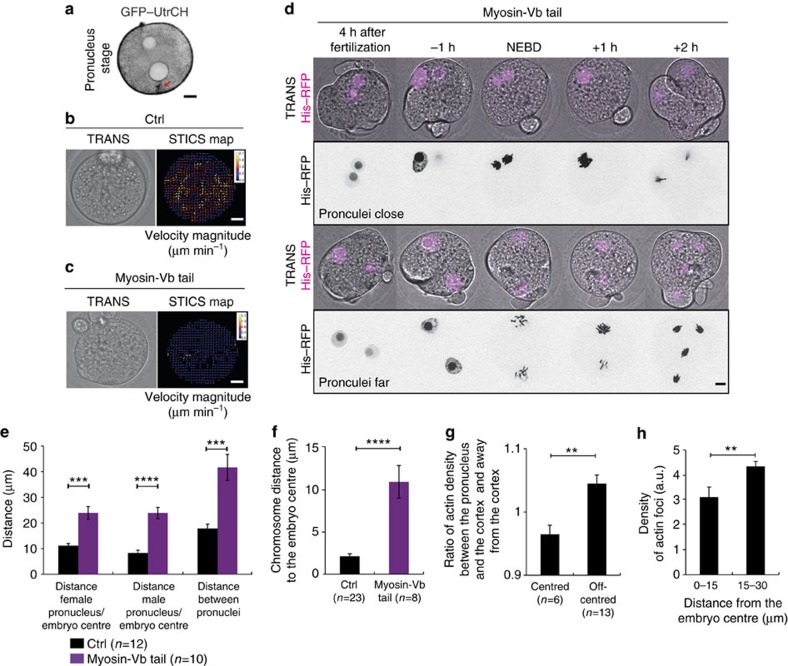
Figure 2. F-actin and Myosin-Vb-driven cytoplasmic flows position the pronuclei in the central region of the embryo.
(a) Control embryo expressing GFP–UtrCH (black, one Z-plane is shown). The red arrow points at actin enrichment. Scale bar, 10 μm. (b,c) Left panels: embryos expressing (c) or not (b) Myosin-Vb tail. Right panels: associated vector maps of cytoplasmic flows obtained using STICS analysis. Heat bar unit in micrometres per minute. Scale bars, 10 μm. One example is shown out of 11 controls and 13 Myosin-Vb tail embryos. (d) Embryos expressing His–RFP (purple or black, Z-projection over 20 μm). Upper panels: pronuclei close; lower panels: pronuclei far. Scale bar, 10 μm. (e) Bar graph showing the pronuclei distance to the embryo centre and to each other 1 h before NEBD for controls (black bars) or Myosin-Vb tail-expressing embryos (purple bars). Mean is shown of 12 controls and 10 Myosin-Vb tail embryos. s.e.m. is plotted on each bar. Statistical significance of differences is assessed with a t-test or a t-test with Welch correction (P values: female pronuclei/embryo centre: 0.0005; male pronuclei/embryo centre <0.0001; between pronuclei: 0.0009). (f) Bar graph showing the chromosome mass distance to the embryo centre in metaphase for controls (black bar) and Myosin-Vb tail-expressing embryos (purple bar). Mean is shown for 23 controls and 8 Myosin-Vb tail embryos. s.e.m. is plotted on each bar. Statistical significance of differences is assessed with a Mann–Whitney test (P value <0.0001). (g) Graph bar showing the ratio of GFP–UtrCH fluorescent intensity between the pronucleus and the cortex and on the other side of the pronucleus. Mean is shown for 6 centred and 13 off-centred pronuclei embryos. s.e.m. is plotted on each bar. Statistical significance of the difference is calculated with a Mann–Whitney test (P value 0.0014). (h) Graph bar showing the mean percentage of actin-positive foci in each region of the embryo normalized by the effective surface of the region. Mean is shown from 9 embryos out of 2 independent experiments. s.e.m. is plotted on each bar. Statistical significance of the difference is calculated with a Mann–Whitney test (P values 0.007).

