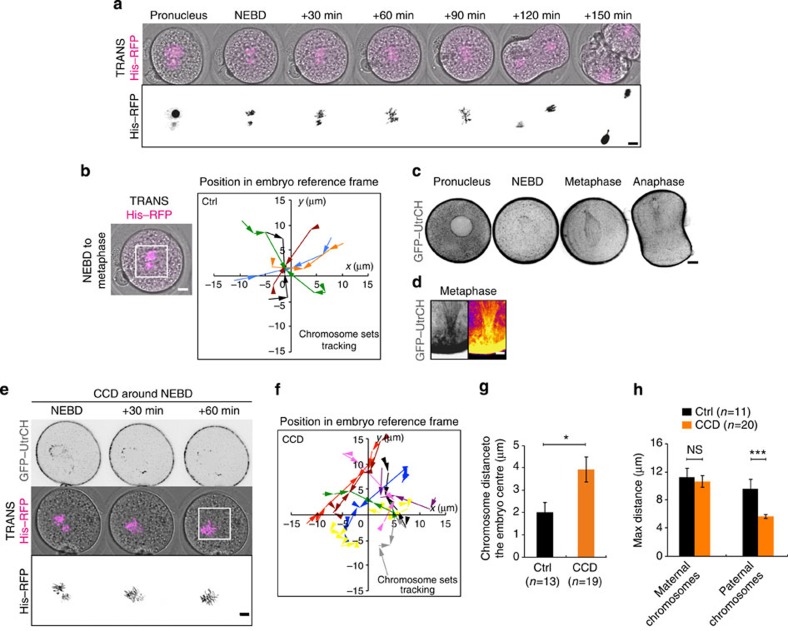
Figure 3. Fine chromosome centring in mitosis is actin dependent.
(a) Control embryo expressing His–RFP (purple or black, Z-projection over 20 μm). Scale bar, 10 μm. (b) Left panel: Control embryo expressing His–RFP (purple, Z-projection over 20 μm) during chromosome migration. Scale bar, 10 μm. Right panel: graph showing the position of the centroid of the two sets of chromosomes in the referential of the embryo (0 being the centre) from NEBD to metaphase for controls. The scale is represented by the white box on the left panel. Each colour represents an embryo. The arrows point to the position where the chromosomes merge. One time point every 15 or 20 min over 1 h. (c) Embryo expressing GFP–UtrCH (black). One Z-plane is shown every 40 min. Scale bar, 10 μm. (d) Metaphase embryo expressing GFP–UtrCH (left: black. Right: white, higher intensity and black, lower intensity). Zoom on the connection between the actin cage and the cortex (cortex saturated to allow visualization of the actin cage filaments). Scale bar, 5 μm. (e) Embryo treated with 1 μg ml−1 Cytochalasin D (CCD) around NEBD expressing GFP–UtrCH (black, one Z-plane is shown) and His–RFP (purple or black, Z-projection over 20 μm). Scale bar, 10 μm. (f) Same as b for embryos treated with CCD around NEBD. (g) Bar graph showing the position of the centroid of the merged chromosomes for controls (black bar) and embryos treated with CCD around NEBD (orange bar). Mean is shown of 13 controls and 19 CCD embryos. s.e.m. is plotted on each bar. Statistical significance of differences is assessed with a Mann–Whitney test (P value 0.0175). (h) Graph showing the maximum distance (that is, the distance between the points furthest apart on the trajectories) of chromosome motion in controls (black bars, from Supplementary Fig. 1c) and embryos treated CCD around NEBD (orange bars) during the migration of the two sets of chromosomes towards the embryo centre. Mean of 11 controls and 20 CCD embryos are shown over 3 independent experiments. s.e.m. is plotted on each bar. Statistical significance of differences is assessed with t-test or Mann–Whitney tests (P values: female 0.6776; male 0.0004).

