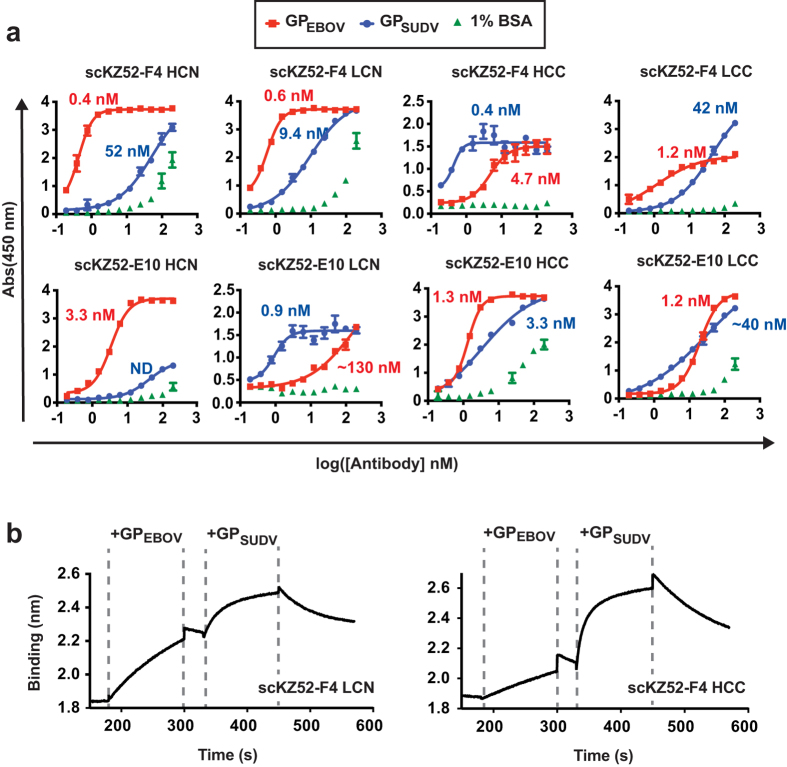
Figure 2. Binding profiles.
(a) ELISA reactivity of the Bis-mAbs for GP lacking the transmembrane domain from EBOV and SUDV were examined. The numerical half-maximal binding titer (EC50) is listed next to each curve. Wells coated with 1% BSA were included as a control for non-specific binding. (b) Two-phase binding experiments for scKZ52-F4 LCN and scKZ52-F4 HCC by biolayer interferometry. The Bis-mAb was loaded onto the probe, and then dipped sequentially into analyte solutions containing GPEBOV then GPSUDV.

