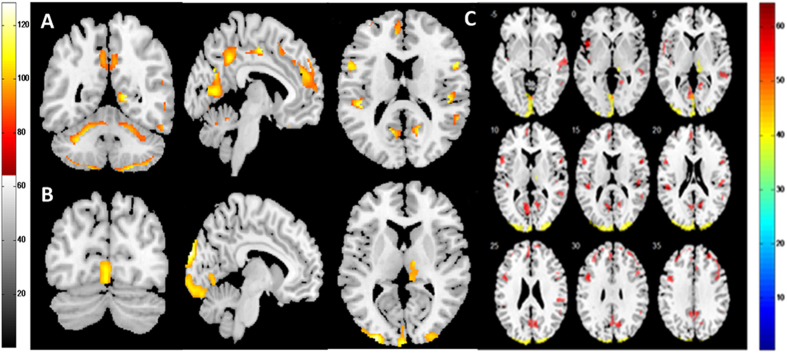
Figure 3. Decreased GM volume in NPSLE patients compared with non-NPSLE patients and HCs.
Red and yellow designate differences in GM volume that were statistically significant at p < 0.05 after correction for multiple comparisons. (A) Coronal, sagittal and axial views of regions with decreased GM in NPSLE patients compared with HCs. (B) Coronal, sagittal and axial views of regions with decreased GM in NPSLE patients compared with non-NPSLE patients. (C) Axial sections showing details of regions with GM decreases in NPSLE patients. Differences between the HCs and NPSLE patients are shown in red; differences between the non-NPSLE and NPSLE patients are shown in yellow. The figure shows that NPSLE patients had decreased GM volume in the limbic cortex, bilateral frontal lobe, temporal lobe, occipital lobe and right thalamus compared with non-NPSLE patients and HCs. Abbreviations: NPSLE = neuropsychiatric systemic lupus erythematosus; HC = healthy control; PCG = posterior cingulate gyrus; GM = grey matter.

