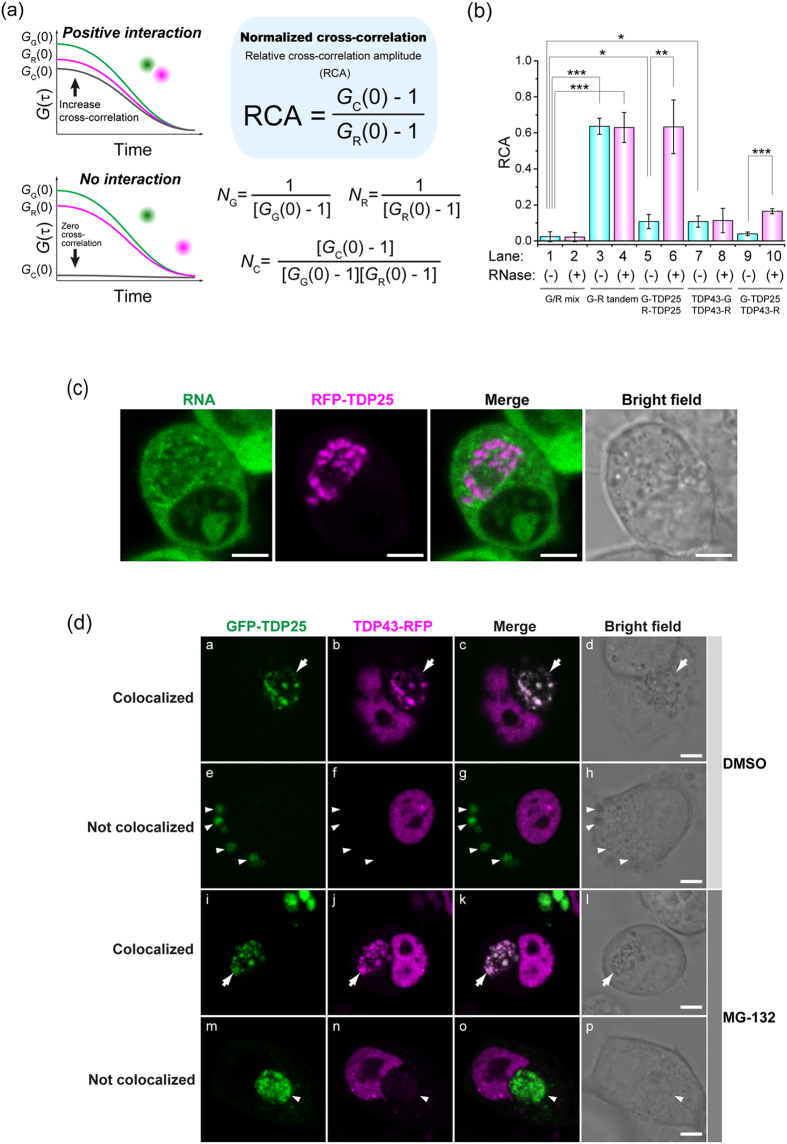
Figure 5. The mechanism of sequestration of TDP43 during TDP25 aggregation.
(a,b) Two-color fluorescence cross-correlation spectroscopy (FCCS). (a) A scheme of FCCS analysis and evaluation of interaction strength using relative cross-correlation amplitude (RCA). (b) RCA values of the interaction between TDP43 and TDP25 in Neuro2A cell lysate with and without RNase treatment. The error bars indicate mean and SD (n = 3). Significance was tested by Student’s t test: *p < 0.05, **p < 0.01, and ***p < 0.001. (c) Colocalization of RNA and TDP25 in the cytoplasmic inclusion bodies (IBs) according to confocal fluorescence microscopy. Scale bar = 5 μm. (d) Colocalization of GFP-TDP25 with TDP43-RFP in the cytoplasmic IB with and without treatment with a proteasome inhibitor according to confocal fluorescence microscopy. The white arrow shows cytoplasmic IBs in which TDP25 is colocalized with TDP43. The white arrow shows IBs containing TDP25 without TDP43. Scale bar = 5 μm.

