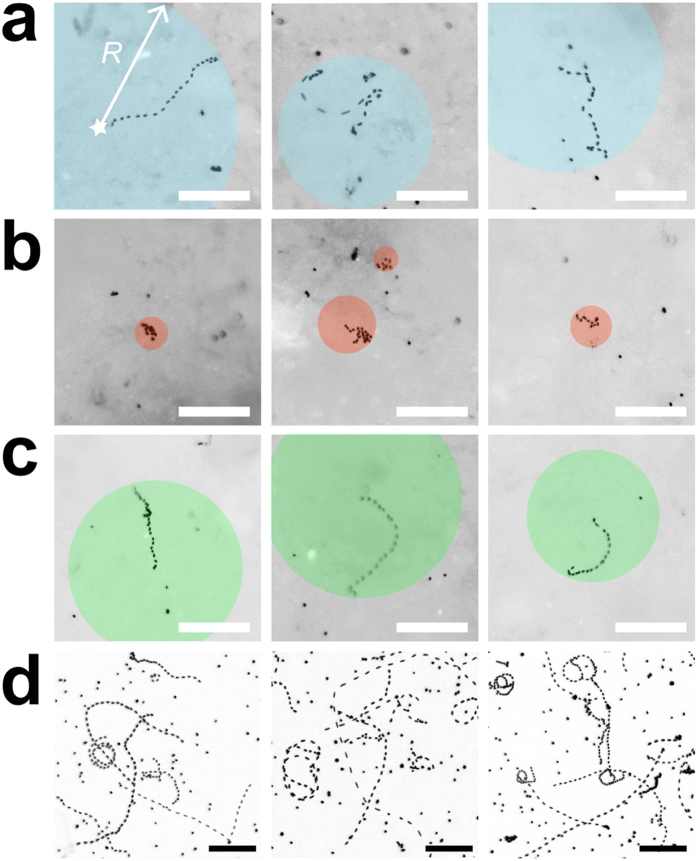
Figure 4. Pseudomonas protegens swimming trajectories in aqueous films.
Micrographs show the projection of a stack of 36 sequential fluorescent images recorded during a 10-sec time lapse. Bacteria were stained with Syto9 for visualization by epifluorescence microscopy. Swimming trajectories appear as dotted lines, with inter-dot gaps proportional to cell velocity. Bar is 50 μm. Examples of individual bacteria swimming on ‘rough’ PSM are shown (a–c). Cells that appear as a single dot are immobilized (attached to the surface). Coloured circles indicate the maximal dispersal distance, defined by radius R measured from the cell position at time 0 (star). (a) Bacteria swimming at matric potential of 0 kPa (water-saturated conditions). (b) Swimming trajectories are constrained when matric potential is brought to –2 kPa (drier conditions). (c) Swimming is reinstated when the matric potential is brought back to 0 kPa. Note that bacteria shown in (a–c) are not the same. (d) Control of bacteria swimming between a glass slide and coverslip. Bacteria that do no exhibit swimming trajectories are attached to glass.

