
Figure 2. Distinct GC/MS peaks in APP mouse urine.
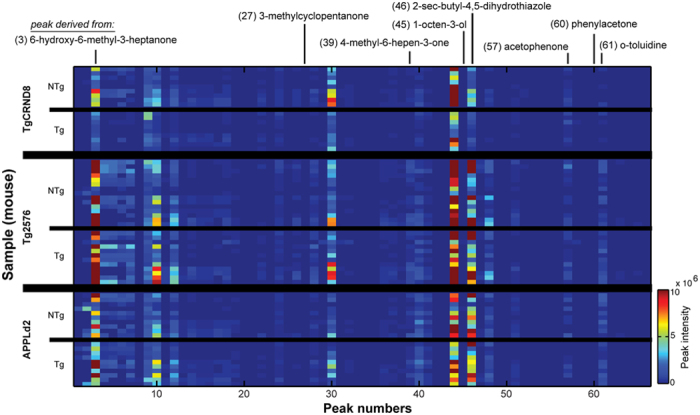
2-dimensional histograms of head-space gas chromatography and mass spectroscopy (GC/MS) results from NTg and APP male mice, across three strains. Y-axis bins = individual mouse results. Data are scaled similarly across all strains and genotypes. Data along the z-axis represent peak areas generated in MSClust (see Materials and Methods). Location of some notable compounds are indicated (also see Table 4).