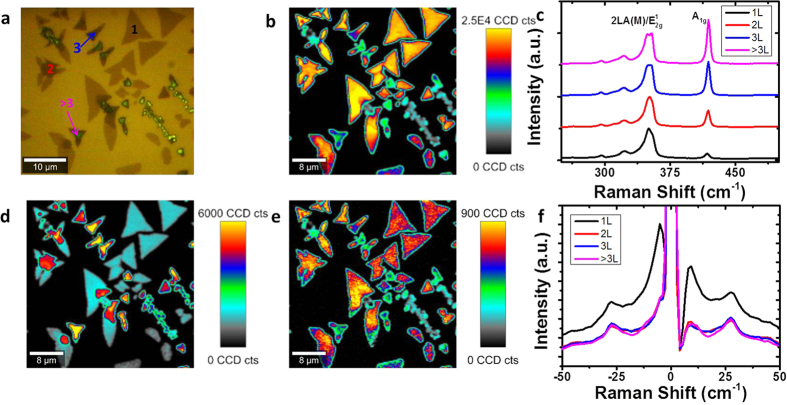
Figure 8.
(a) Optical image of CVD WS2 with varying layer numbers. (b) Peak intensity map of 2LA(M) + E’/Eg/E12g (~352 cm−1). (c) Raman spectra of 1, 2, 3, and >3L WS2 in the high-frequency region. (d) Peak intensity map of max A’1/A1g peak (~417 cm−1). (e) Peak intensity map of low-frequency resonance mode at 27 cm−1 in WS2. (f) Raman spectra of 1, 2, 3, and 4L WS2 in the low-frequency region.

