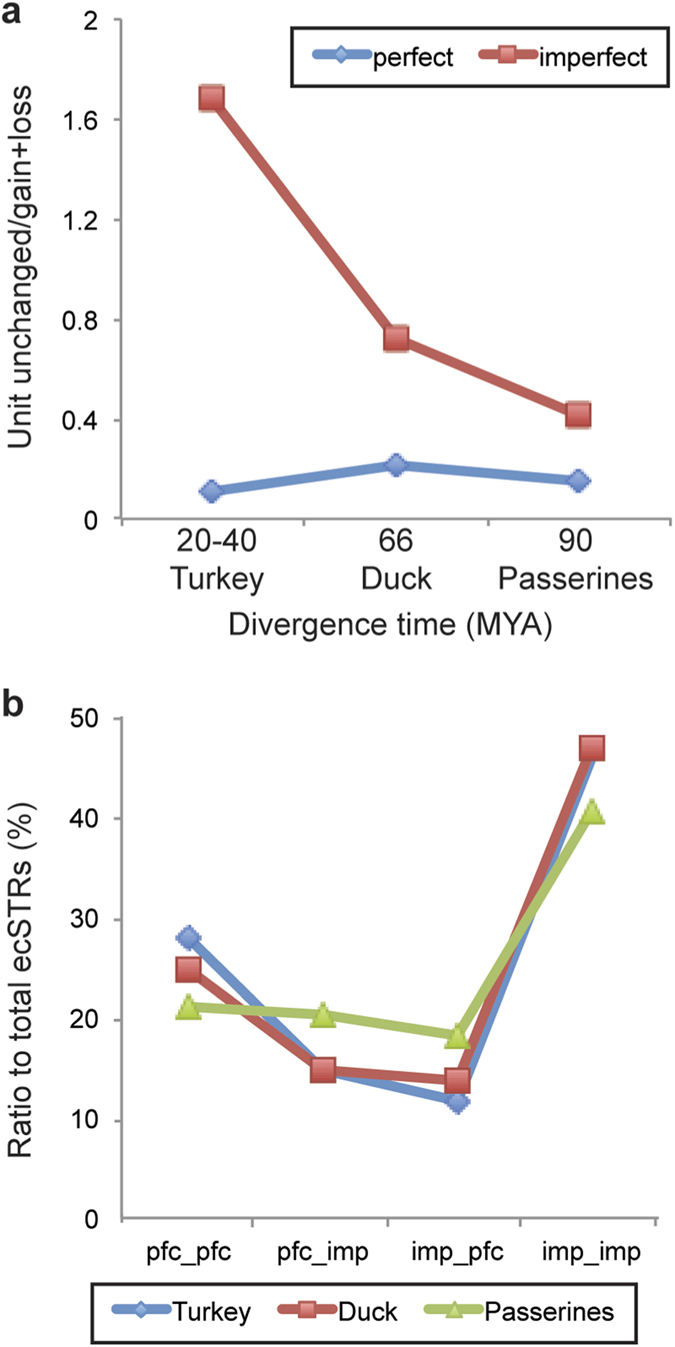
Figure 4. Evolutionary trends of the conserved short tandem repeats with perfect or imperfect dinucleotide repeats.

The Y-axis represents the rate of evolutionary conserved STR (ecSTR) loci that have the same number of repeat units with chicken orthologs against those with gain/loss of units. The X-axis denotes the estimated divergence times from the chicken lineage (a). EcSTRs were sorted into four categories based on their repeat purity, and compared in ratio among avian lineages (b). Here, we express the repeat purity of ecSTRs as “chicken repeats_ortholog repeats”. For example, pfc_pfc means that both orthologs have ecSTRs with perfect repeats, with the same being true for imperfect repeats (imp_imp). Note that several ecSTRs (13.9% to total ecSTR loci) were double counted across different categories as distinct types of repeats. Abbreviations used in this figure are pfc [perfect (pure) repeat], imp [imperfect (interrupted) repeat].
