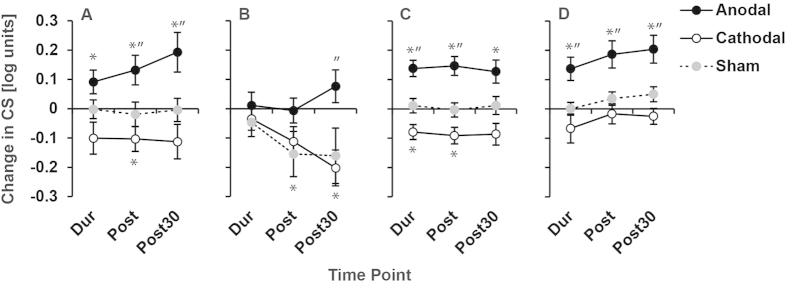
Figure 3. A-tDCS enhanced contrast sensitivity.
The change in log contrast sensitivity relative to baseline after 20 minutes of anodal, cathodal or sham tDCS is shown for amblyopic (A), non-amblyopic (B) and control (C) eyes. Positive values indicate an improvement. Measurements were made during (Dur), directly after (Post) and 30 minutes after (Post30) simulation. For controls, reducing the stimulation duration to 10 minutes did not change the pattern of results (D). * = Significant change from baseline, “ = significant difference from sham (paired t-test, p < 0.05).

