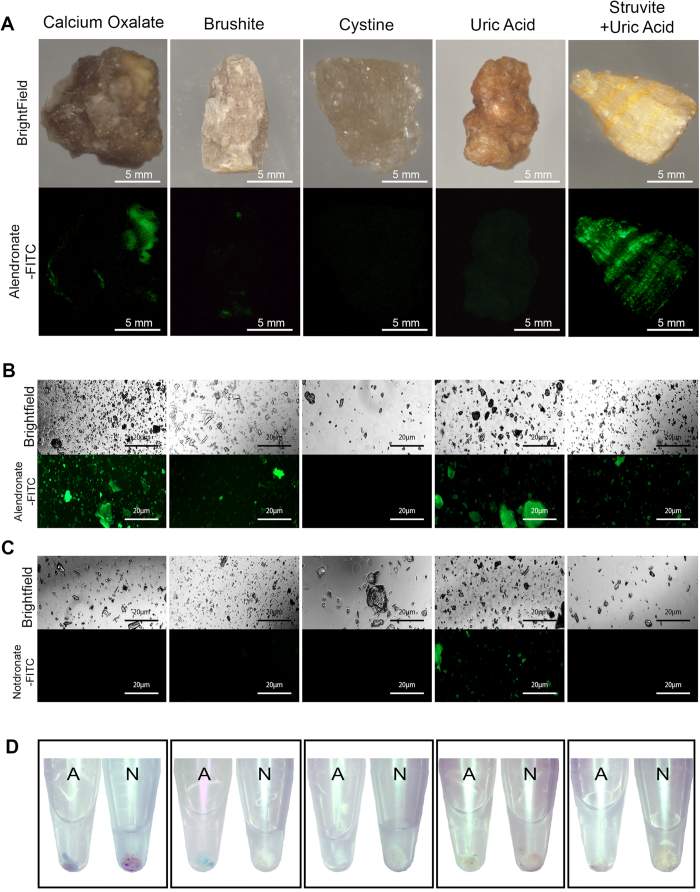
Figure 1. Macroscopic Analysis of Calculi Subtypes with Fluorescent Alendronate Probes.
(A) Macroscopic images of alendronate treated renal calculi of different compositions. Brightfield images are compared to fluorescein channel images. Fluorescein fluoresces green where present; denoted as FITC in figures. (B) Microscopic images of alendronate treated renal calculi fragments of varying compositions. (C) Microscopic images of notdronate treated renal calculi fragments of varying compositions. Uric acid auto fluorescence or unspecified binding is suggested. (D) Macro scale images of alendronate and notdronate treated renal calculi fragments of varying compositions in PBS. Sediment dyed blue indicates presence of Cy5 fixed alendronate or notdronate.

