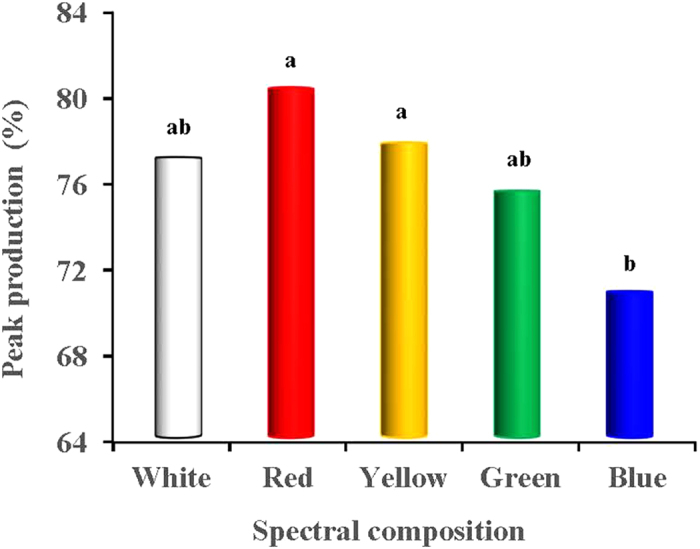
Figure 6. Peak lay rates (%) of each light-treated group.

The peak lay rate of white-, red-, yellow- and green-treated groups were occurred at 29 week, whereas the peak lay rate of blue treated group was occurred at 33 week. Data are expressed as the mean value ± SD. a,bThe mean values without a common superscript indicates significant differences (P < 0.05).
