
Figure 7. Abnormal egg production (%) of each light-treated group.
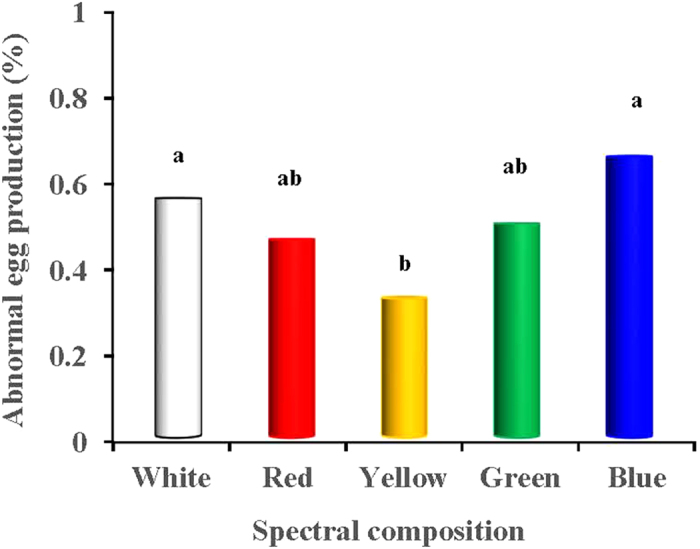
We measured the abnormal egg (including deformity, crack, etc.) numbers daily, then calculated the abnormal egg rate. Data are expressed as the mean value ± SD. a,bThe mean values without a common superscript indicates significant differences (P < 0.05).