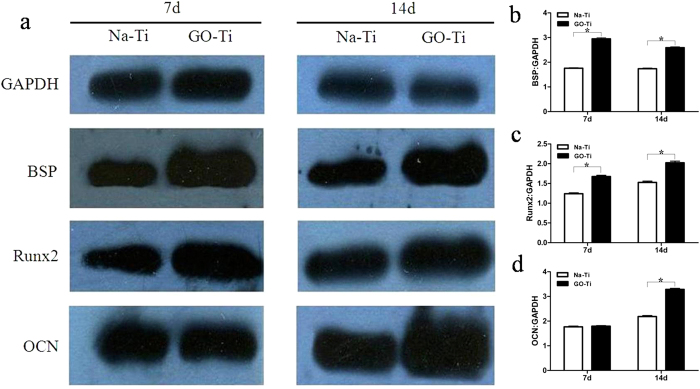
Figure 8. Protein expression of BSP, Runx2 and OCN in PDLSCs on Na-Ti and GO-Ti substrates.
(a) Time-related expression of BSP, Runx2 and OCN in PDLSCs as analyzed by Western blot. (b) Quantitative analysis of the protein expression of BSP. (c) Quantitative analysis of the protein expression of Runx2. (d) Quantitative analysis of the protein expression of OCN. Protein expression is normalized to GAPDH expression. PDLSCs were cultivated for 7 and 14 days on Na-Ti and GO-Ti substrates. Data represent means ± SD (n = 5). *P < 0.05, **P < 0.01, Na-Ti versus GO-Ti.

