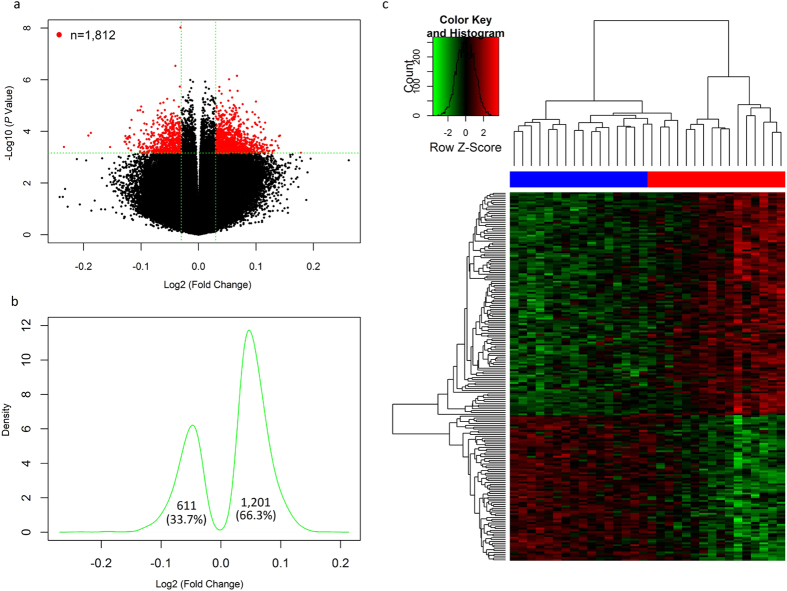
Figure 1. Differentially methylated CpGs in male subjects with alcohol use disorders (AUDs).
(a) Volcano plot of effect size [log2(fold changes)] against −log10(P values) of 434, 015 CpGs. The red dots represent 1,812 CpGs with q ≤ 0.05 (the horizontal green dash line) and the absolute value of log2(fold change) >0.03 (two vertical green dash lines), and the black dots represent non-significant CpGs. (b) Kernel density plotting of log2(fold changes) of 1,812 significant CpGs. The asymmetric plot indicates that a greater proportion (66.3%) of CpGs were hypermethylated in AUD subjects. (c). Hierarchical clustering of the 32 male subjects using a heatmap based on methylation levels of the above 1,812 CpGs (adjusted for age and PMI). The 32 male subjects were clustered into two distinct groups that were consistent with their actual AUD status (the red color: 16 male AUD patients; the blue color: 16 male healthy control subjects). The colors in the heatmap indicate CpG methylation levels (green to red: low to high methylation levels).

