
Figure 3. Pairs of hypo- or hypermethylated CpGs and up- or downregulated genes in postmortem PFC of male AUD subjects.
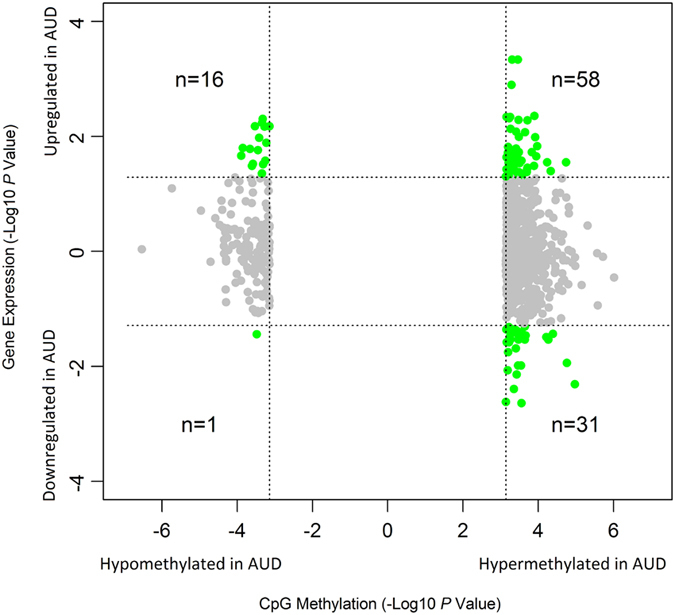
Vertical and horizontal dash lines indicate significantly changed CpG methylation and gene expression, respectively.
Official websites use .gov
A
.gov website belongs to an official
government organization in the United States.
Secure .gov websites use HTTPS
A lock (
) or https:// means you've safely
connected to the .gov website. Share sensitive
information only on official, secure websites.
Vertical and horizontal dash lines indicate significantly changed CpG methylation and gene expression, respectively.