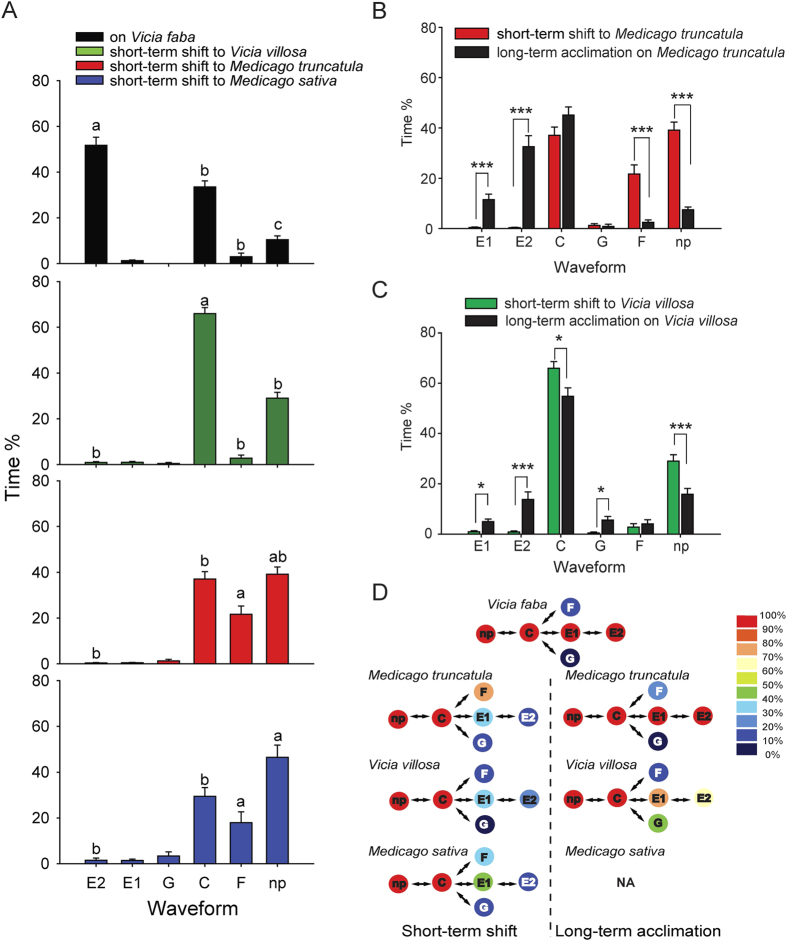
Figure 3. Feeding behaviors of pea aphids fed on different host plants measured by electrical penetration graph technique.
E1, watery salivation. E2, passive ingestion. C, probing plant cells. F, derailed stylet. G, drinking from xylem. np, non-probing. Time ratios (time spent in each waveform divided by 5 h) were reported as mean ± SEM. (A) Comparison of feeding behavior of the YYC clone before and after a short-term shift to Medicago truncatula, Vicia villosa, or Medicago sativa. Different letters above columns indicates a significant difference of the same waveform in different groups evaluated by ANOVA using SPSS 17.0. (B) Comparison of feeding behavior of the YYC clone after a short-term shift to M. truncatula for 5 h and after a long-term acclimation on M. truncatula for six months. ***P < 0.001. (C) Comparison of feeding behavior of the YYC clone after a short-term shift to V. villosa for 5 h and after a long-term acclimation on V. villosa for six months. *P < 0.05; ***P < 0.001. (D) Model diagram to show feeding behavior patterns of the pea aphids before and after alteration to different host plants. Colors represent the ratios of individuals entering a certain feeding step in a group of aphids (30 individuals per group).

