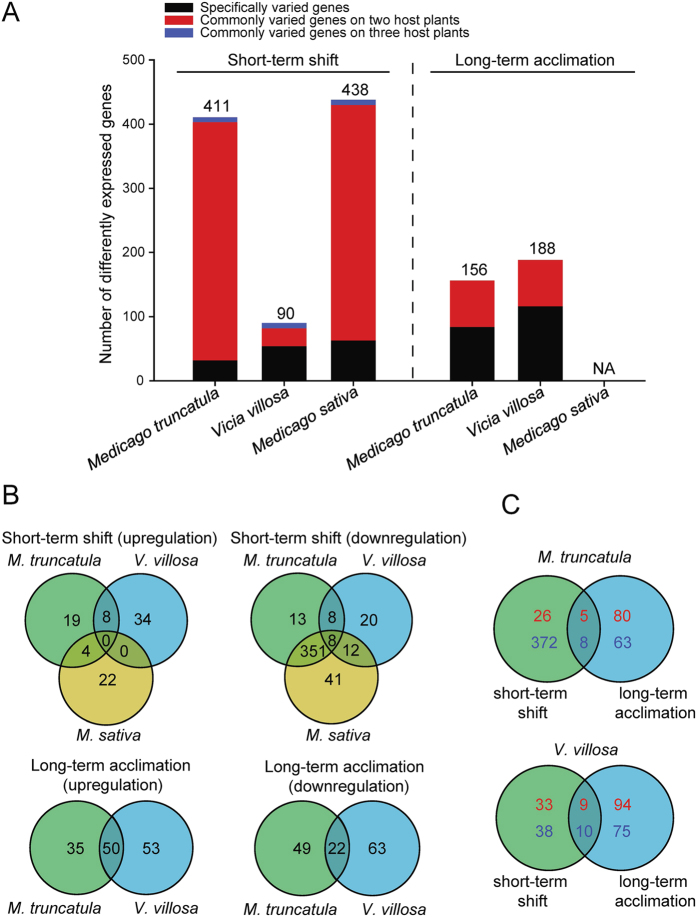
Figure 5. Numbers of differently expressed genes in aphid salivary glands when the YYC clone was short-term shifted to or long-term acclimation for six months on Vicia villosa, Medicago truncatula, or Medicago sativa.
(A) Total numbers of differentially expressed genes. (B,C) Venn diagram showing the similarity of differentially expressed genes. Red and blue numbers in (C) delegate upregulated and downregulated gene numbers, respectively.

