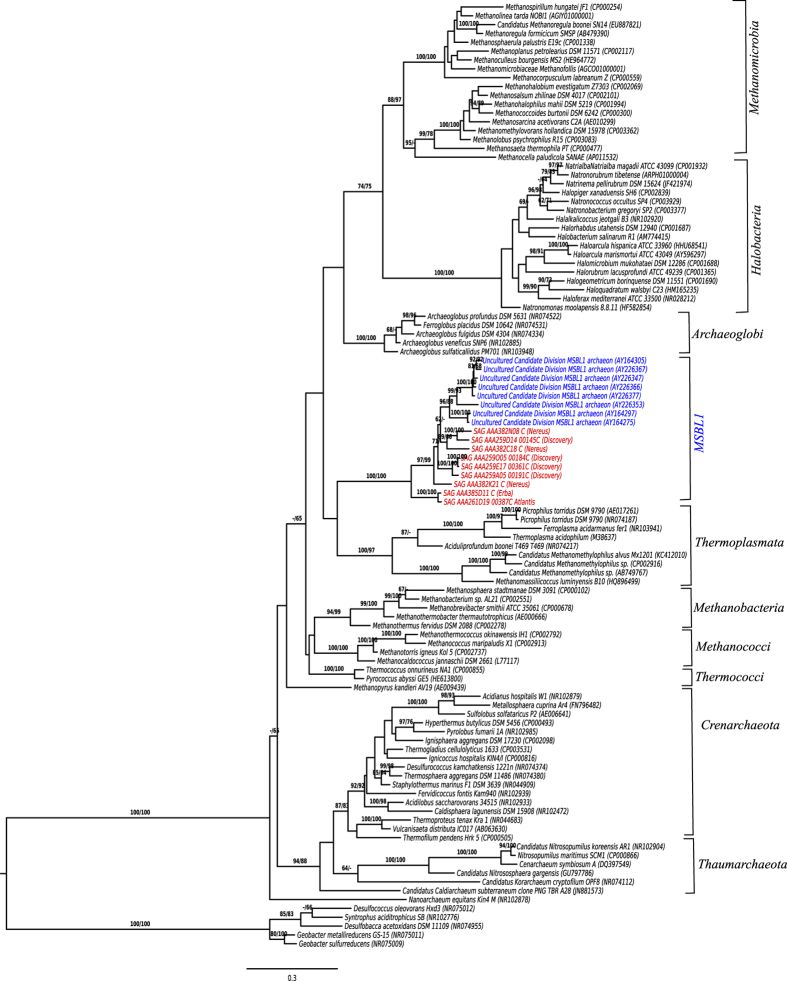
Figure 2. Maximum likelihood (ML) phylogenetic tree inferred using only nearly complete 16S rRNA genes from SAGs of Brine Pools from the Red Sea (in red) and comparative sequences from the NCBI database including MSBL1 sequences from Brine Pools in the Mediterranean (blue).
The branches are scaled in terms of the expected number of substitutions per site. Numbers above branches are support values from ML (left) and maximum parsimony (MP; right) bootstrapping. The tree was rooted with selected bacterial sequences.

