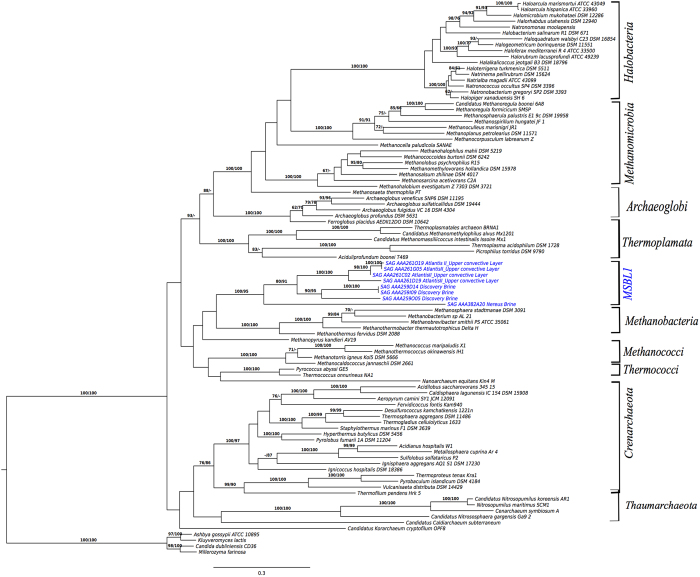
Figure 3. Maximum likelihood (ML) phylogenetic tree inferred from the amino-acid matrix of 10 concatenated archaeal proteins present in eight of the MSBL1 SAGs (in blue) and other archaeal genomes.
The same set of proteins from selected Eukaryota was included as out-group. The branches are scaled in terms of the expected number of substitutions per site. Numbers above branches are bootstrapping support values from ML (left) and maximum parsimony (MP; right). The ‘prot’ amino-acid matrix comprised 94 operational taxonomic units and 1305 characters, 1207 of which were variable and 1159 of which were parsimony-informative. ML analysis under the LG model yielded a highest log likelihood of -104791.64, whereas the estimated alpha parameter was 0.95. The bootstrapping converged after 350 replicates; the average support was 78.52%. MP analysis yielded a best score of 20784 (consistency index 0.32, retention index 0.59) and 14 best tree(s). The MP bootstrapping average support was 73.25%.

