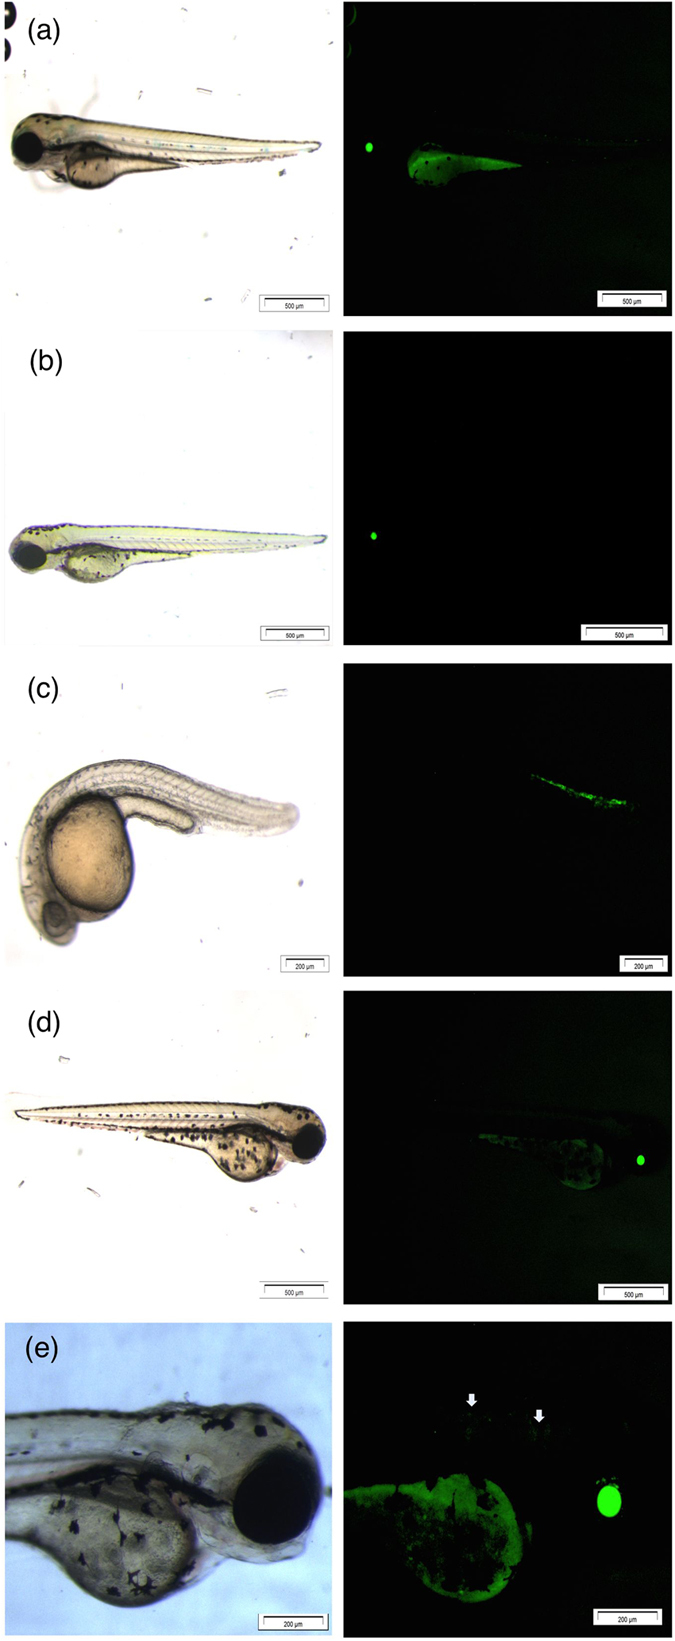
Figure 7.

Stereoscopic (left-hand side) and fluorescent pictures (right-hand side) of Tg(hsp70l:GFP) with (a) control, (b) SnI2 3 dpf at 2.16·10-1 mM, (c) PbI2 1 dpf at 1.08 mM, (d) PbI2 3 dpf at 5.4·10-3 mM and (e) being the magnification of (d). Scale bars: (a): 500 μm; (b): 500 μm; (c): 200 μm; (d): 500 μm; (e): 200 μm.
