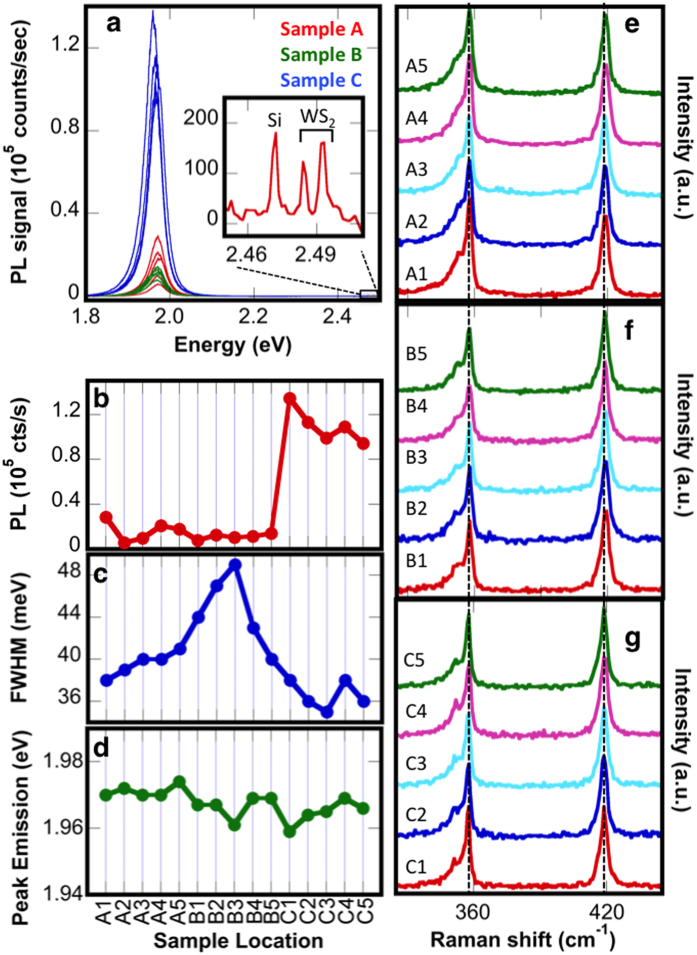
Figure 3. Comparisons of monolayer WS2 synthesized under different recipes.
(a) WS2 synthesized using recipe C repeatedly results in the highest intensity PL emission. The Raman peaks from WS2 and the Si substrate are also measureable (inset). The large PL/Raman ratio demonstrates the high luminescent efficiency. Values for (b) PL intensity, (c) full width at half maximum, and (d) PL peak position are shown for multiple randomly selected monolayer locations on a given sample. (e–g) The corresponding Raman spectra are displayed. The E12g and A1g Raman peaks are observed at 357.5 cm−1 and 419 cm−1 for all WS2, as indicated by dashed vertical lines.

