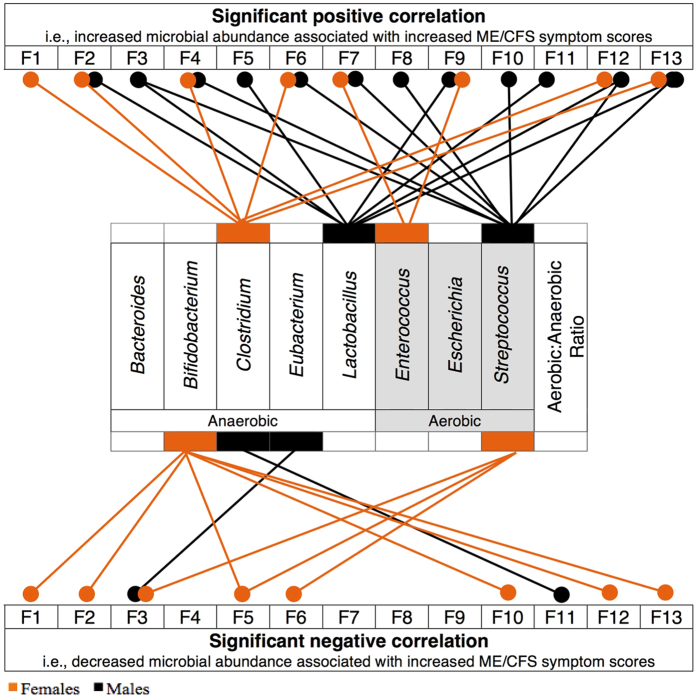
Figure 1. Associations between microbiota relative abundance and ME/CFS symptoms (F1–F13) for females (nrange = 120–170, orange), and males (nrange = 57–77, black).
Only significant results from Spearman’s rank correlations are presented (P < 0.05). Anaerobic (white) and aerobic (grey) bacteria genera are distinguished. The Aerobic:Anaerobic Ratio: total detectable aerobic bacteria divided by total detectable anaerobic bacteria multiplied by 1000 (including but not limited to the selected genera presented above).

