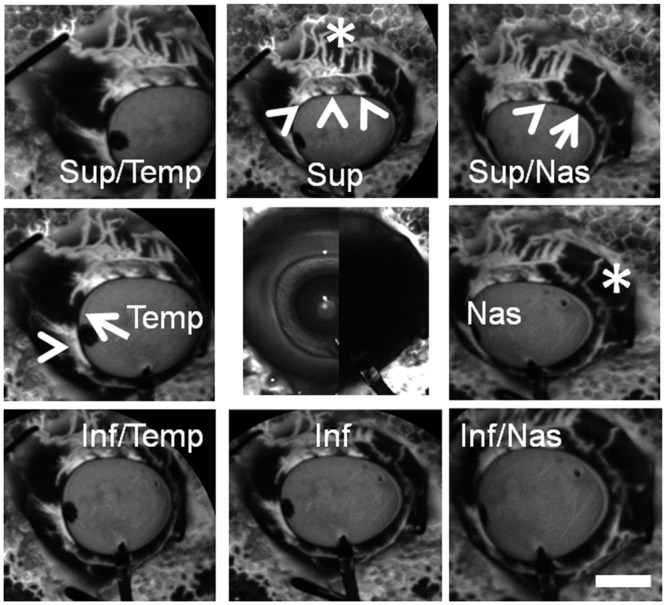
Fig 2. Aqueous Angiography Shows Segmental Patterns.

Images from nine cardinal positions were taken on a representative pig eye demonstrating segmental and differentially emphasized angiographic patterns. Arrowheads denoted regions of peri-limbal proximal (TM/AP/CC) signal and asterisks highlighted regions of distal signal (episcleral). Arrows showed areas of relatively low per-limbal signal. The central image was a composite image of cSLO infrared (left side) and pre-injection background (right side) images. Note that the pre-injection background was even less intense than that of the stained styrofoam (polygonal background pattern) that the eye was attached to. Sup = superior; temp = temporal, nas = nasal; inf = interior. Scale bar = 1 cm.
