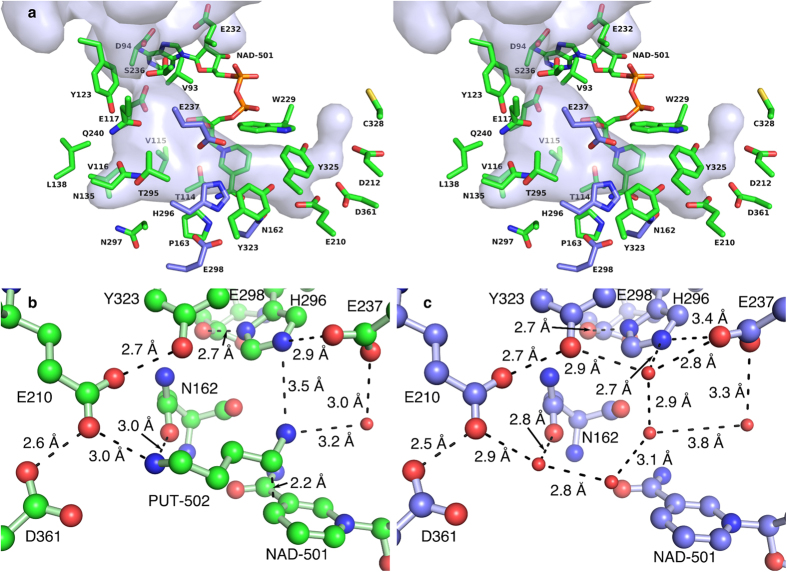
Figure 3. Residues of the binding pocket of BvHSS.
(a) Walled-eye 3D stereoscopic visualization of all relevant residues near the binding pocket of BvHSS. The substrate binding pocket is displayed as a surface-rendered cavity in light blue with the adjacently bound NAD+ and the side chains including the Cα carbons of the relevant residues (in stick representation). The carbons of residues replaced in the four variants are colored in blue, all other carbons are colored in green. (b,c) Relevant residues, NAD-501, and PUT-502 at the active site are shown as ball-and-stick representations. Relevant water molecules are shown as red spheres. All distances (indicated by dashed lines) were measured with the measurement function implemented in the program PyMOL. To avoid the mis-interpretation of panel (b,c) as a stereo representation, the carbons are shown in green (b) or blue (c). (b) The active site of BvHSS with bound PUT (PDB ID: 4TVB, subunit B). (c) The active site of BvHSS without substrate (PDB ID: 4XQC, subunit B).

