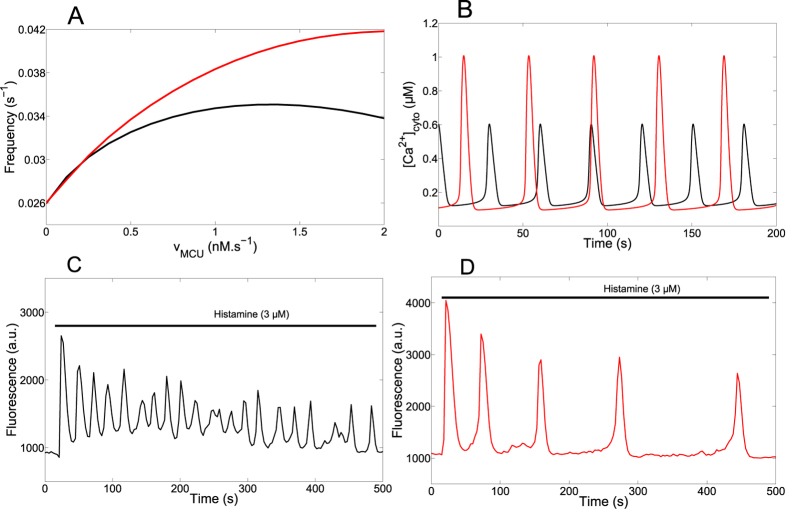
Figure 4. The rate of Ca2+ entry into mitochondria alters cytosolic Ca2+ oscillations.
(A) Relationship between the frequency of oscillations and the rate constant of the MCU. The rate constant of the NCX is the default value (black curve, VNCX = 0.35 μM.s−1) or is increased (red curve, VNCX = 1 μM.s−1). (B) Effect of the rate constant of the MCU on cytosolic Ca2+ oscillations, as predicted by the model. The black curve shows oscillations for the default value (VMCU = 0.0006 μM.s−1) given in Table 1, while the red curve shows oscillations obtained when VMCU = 0. (C,D) Measurement of Ca2+ variations in control (C) or MCU-silenced HeLa cells (D). Cells loaded with Fluo4 were perfused with 3 μM histamine for the time shown by the black line. Experiments are representative of more than five trials. See also Supplementary Fig. S4.

