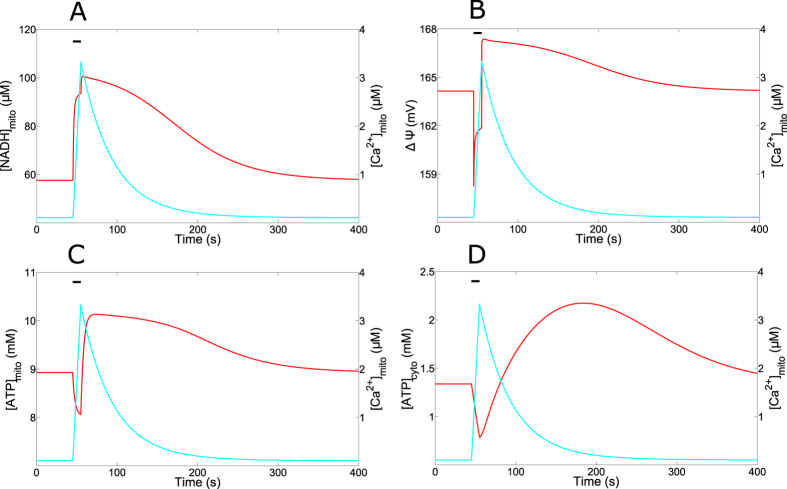
Figure 6. Dynamics of mitochondrial variables.
Curves show the simulated changes in the concentrations of the variables related to mitochondrial metabolism in response to a square-wave Ca2+ pulse in the cytosol (1.5 μM for 10 s). In all panels, the horizontal line indicates the time of the Ca2+ pulse. Mitochondrial Ca2+ is shown in blue and the variable indicated on the vertical left axis in red. Parameter values are listed in Table 1.

