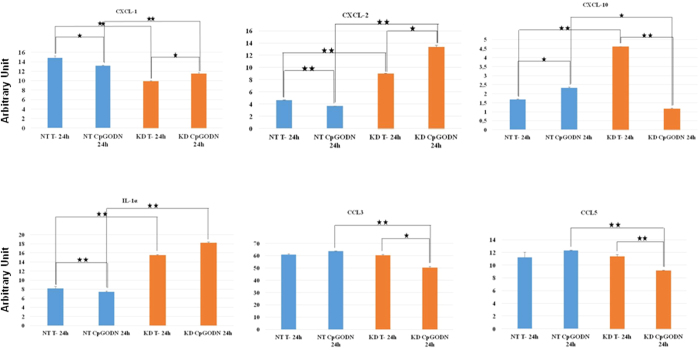
Figure 11. Cytokines secreted by NT and KD cells during challenge (or not) with CpG-ODN.
Cells were untreated (control) or treated with 1 μM CpG-ODN for 24 h. A Rat Cytokine Array was used to probe cytokines in the secretomes. The NT cell secretomes are shown in blue and the KD cell secretomes are depicted in orange. The bar diagrams show the ratios of the spot mean pixel densities/reference point pixel densities. Significant differences were analyzed using Student’s t-test. *P ≤ 0.05, **P ≤ 0.01.

