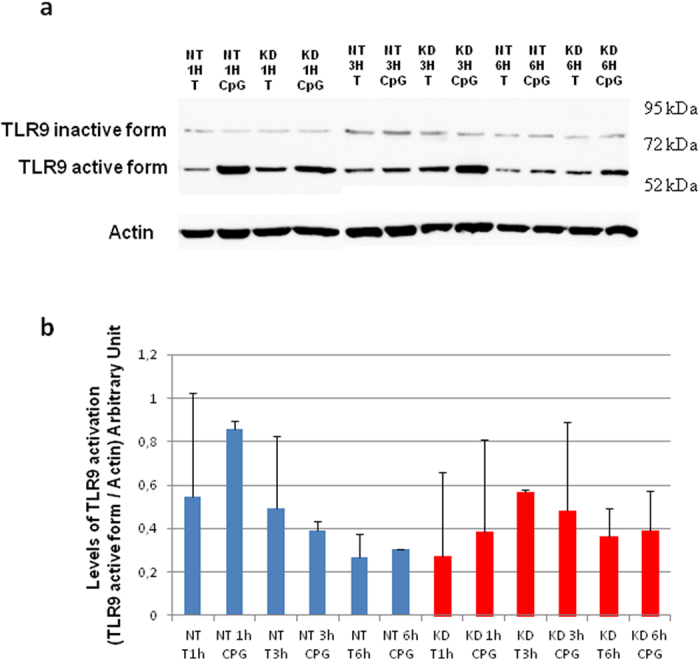
Figure 6. PC1/3 does not control TLR9 activation by proteolytic cleavage.

Non-target (NT) and PC1/3 knockdown (KD) NR8383 cells were exposed to 1 μM CpG-ODN 2006 for 1, 3 or 6 h. (a) Proteins were then extracted, and western blotting was carried out with anti-TLR9. Intensities of 64 kDa bands corresponding to TLR9 active form were quantified and normalized to that of actin. (b) The results are depicted through graphic representations. Experiments were performed in triplicate and the data are presented as the mean ± SD. Data were then analyzed by three ways ANOVA followed by Holm-Sidak posthoc test.
