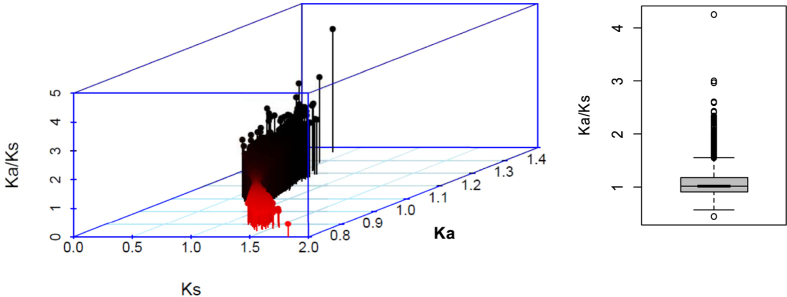
Figure 5. The synonymous, nonsynonymous mutatation rates and Ka/Ks value of orthologs between the upland and lowland rice accessions in the present study.
The 3D scatter plot at the left shows the Ks at X-axis, Ka at Y-axis and Ka/Ks at the Z-axis. The right box plot displays the range of Ka/Ks values and with the mean of about 1.

