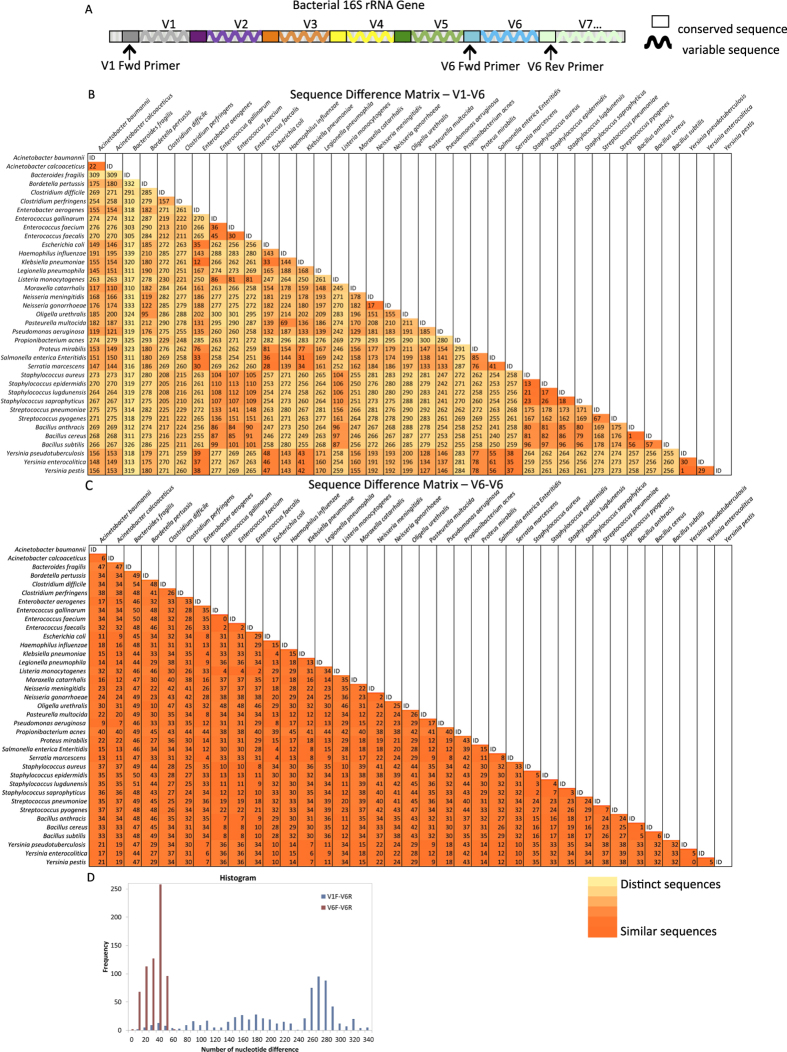
Figure 1. Bacterial 16 S ribosomal RNA (rRNA) gene map.
(A) Diagram of bacterial 16 S rRNA gene showing seven (denoted V1-V7) of nine total hypervariable regions. Universal 16 S primers locate in conserved regions. Long amplicons include all six hypervariable regions (V1 through V6) by having universal forward primer (V1 Fwd) located before V1 and universal reverse primer (V6 Rev) located after V6. Short amplicons cover the V6 region by having universal forward (V6 Fwd) and reverse (V6 Rev) primers flanking the V6 region. (B) Sequence difference matrix of LAM V1-V6 amplicons of 37 organisms showing the number of nucleotide differences of the organisms compared with each other. Darker shading indicates fewer sequence differences, i.e. higher similarity, while light shading indicates greater sequence differences, i.e. lower similarity. (C) Sequence difference matrix of the V6 amplicon sequence among the same 37 organisms with same shading scale applied. (D) Histogram of sequence difference matrices in B & C showing a wider range of sequence differences among the one to one organism comparisons using the longer V1-V6 amplicon.

