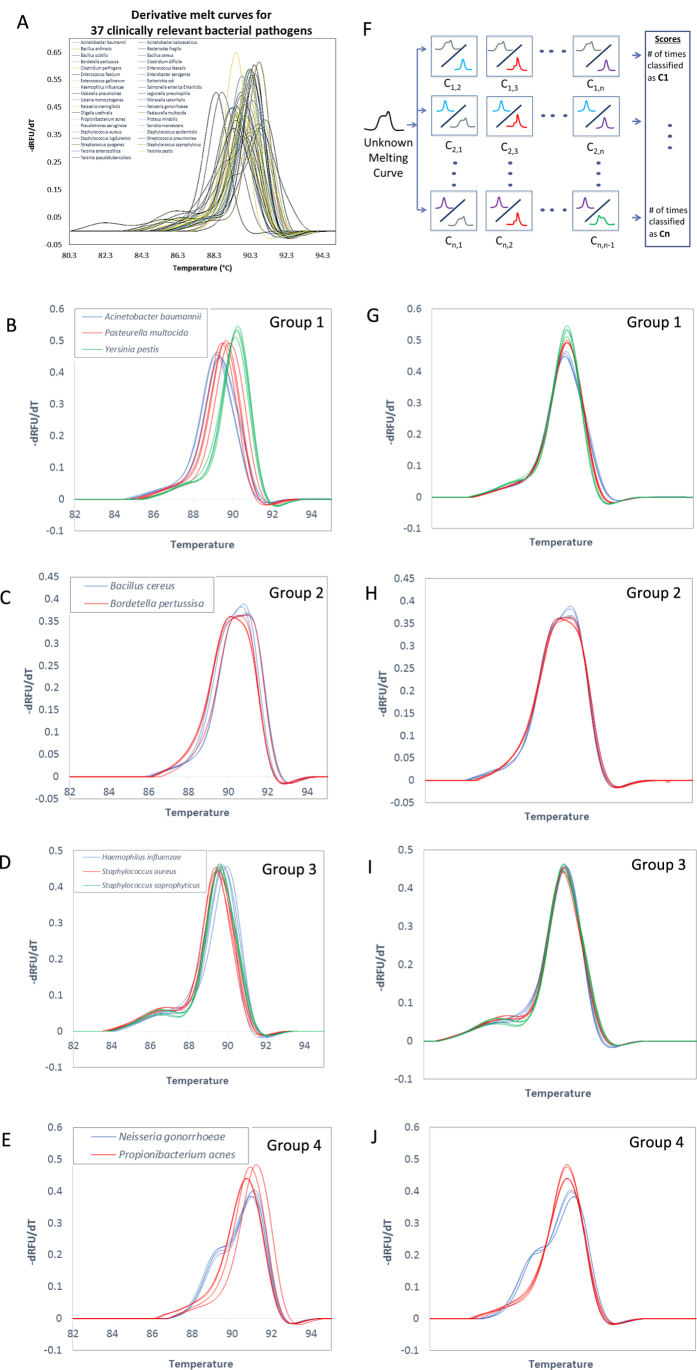
Figure 3. LAM curves with SVM melt curve classification.
(A) LAM curves aligned by temperature calibrators of all 37 organisms showing LAM curve diversity. One representative curve from each organism. (B–E) Melt curves of organisms that are grouped together in SVM round one, which then proceed to SVM round two for further distinction. (F) One-vs.-one ensemble SVM scheme. An unknown curve is tested against each organism-pair SVM. An unknown curve will be called as organism C1 if organism C1 has the maximum score comparing to other organisms. (G–J) Derivative melt curves of each SVM round one group, (B–E), after shifting for SVM round two. This level classifies based on differences in shape without Tm consideration.

